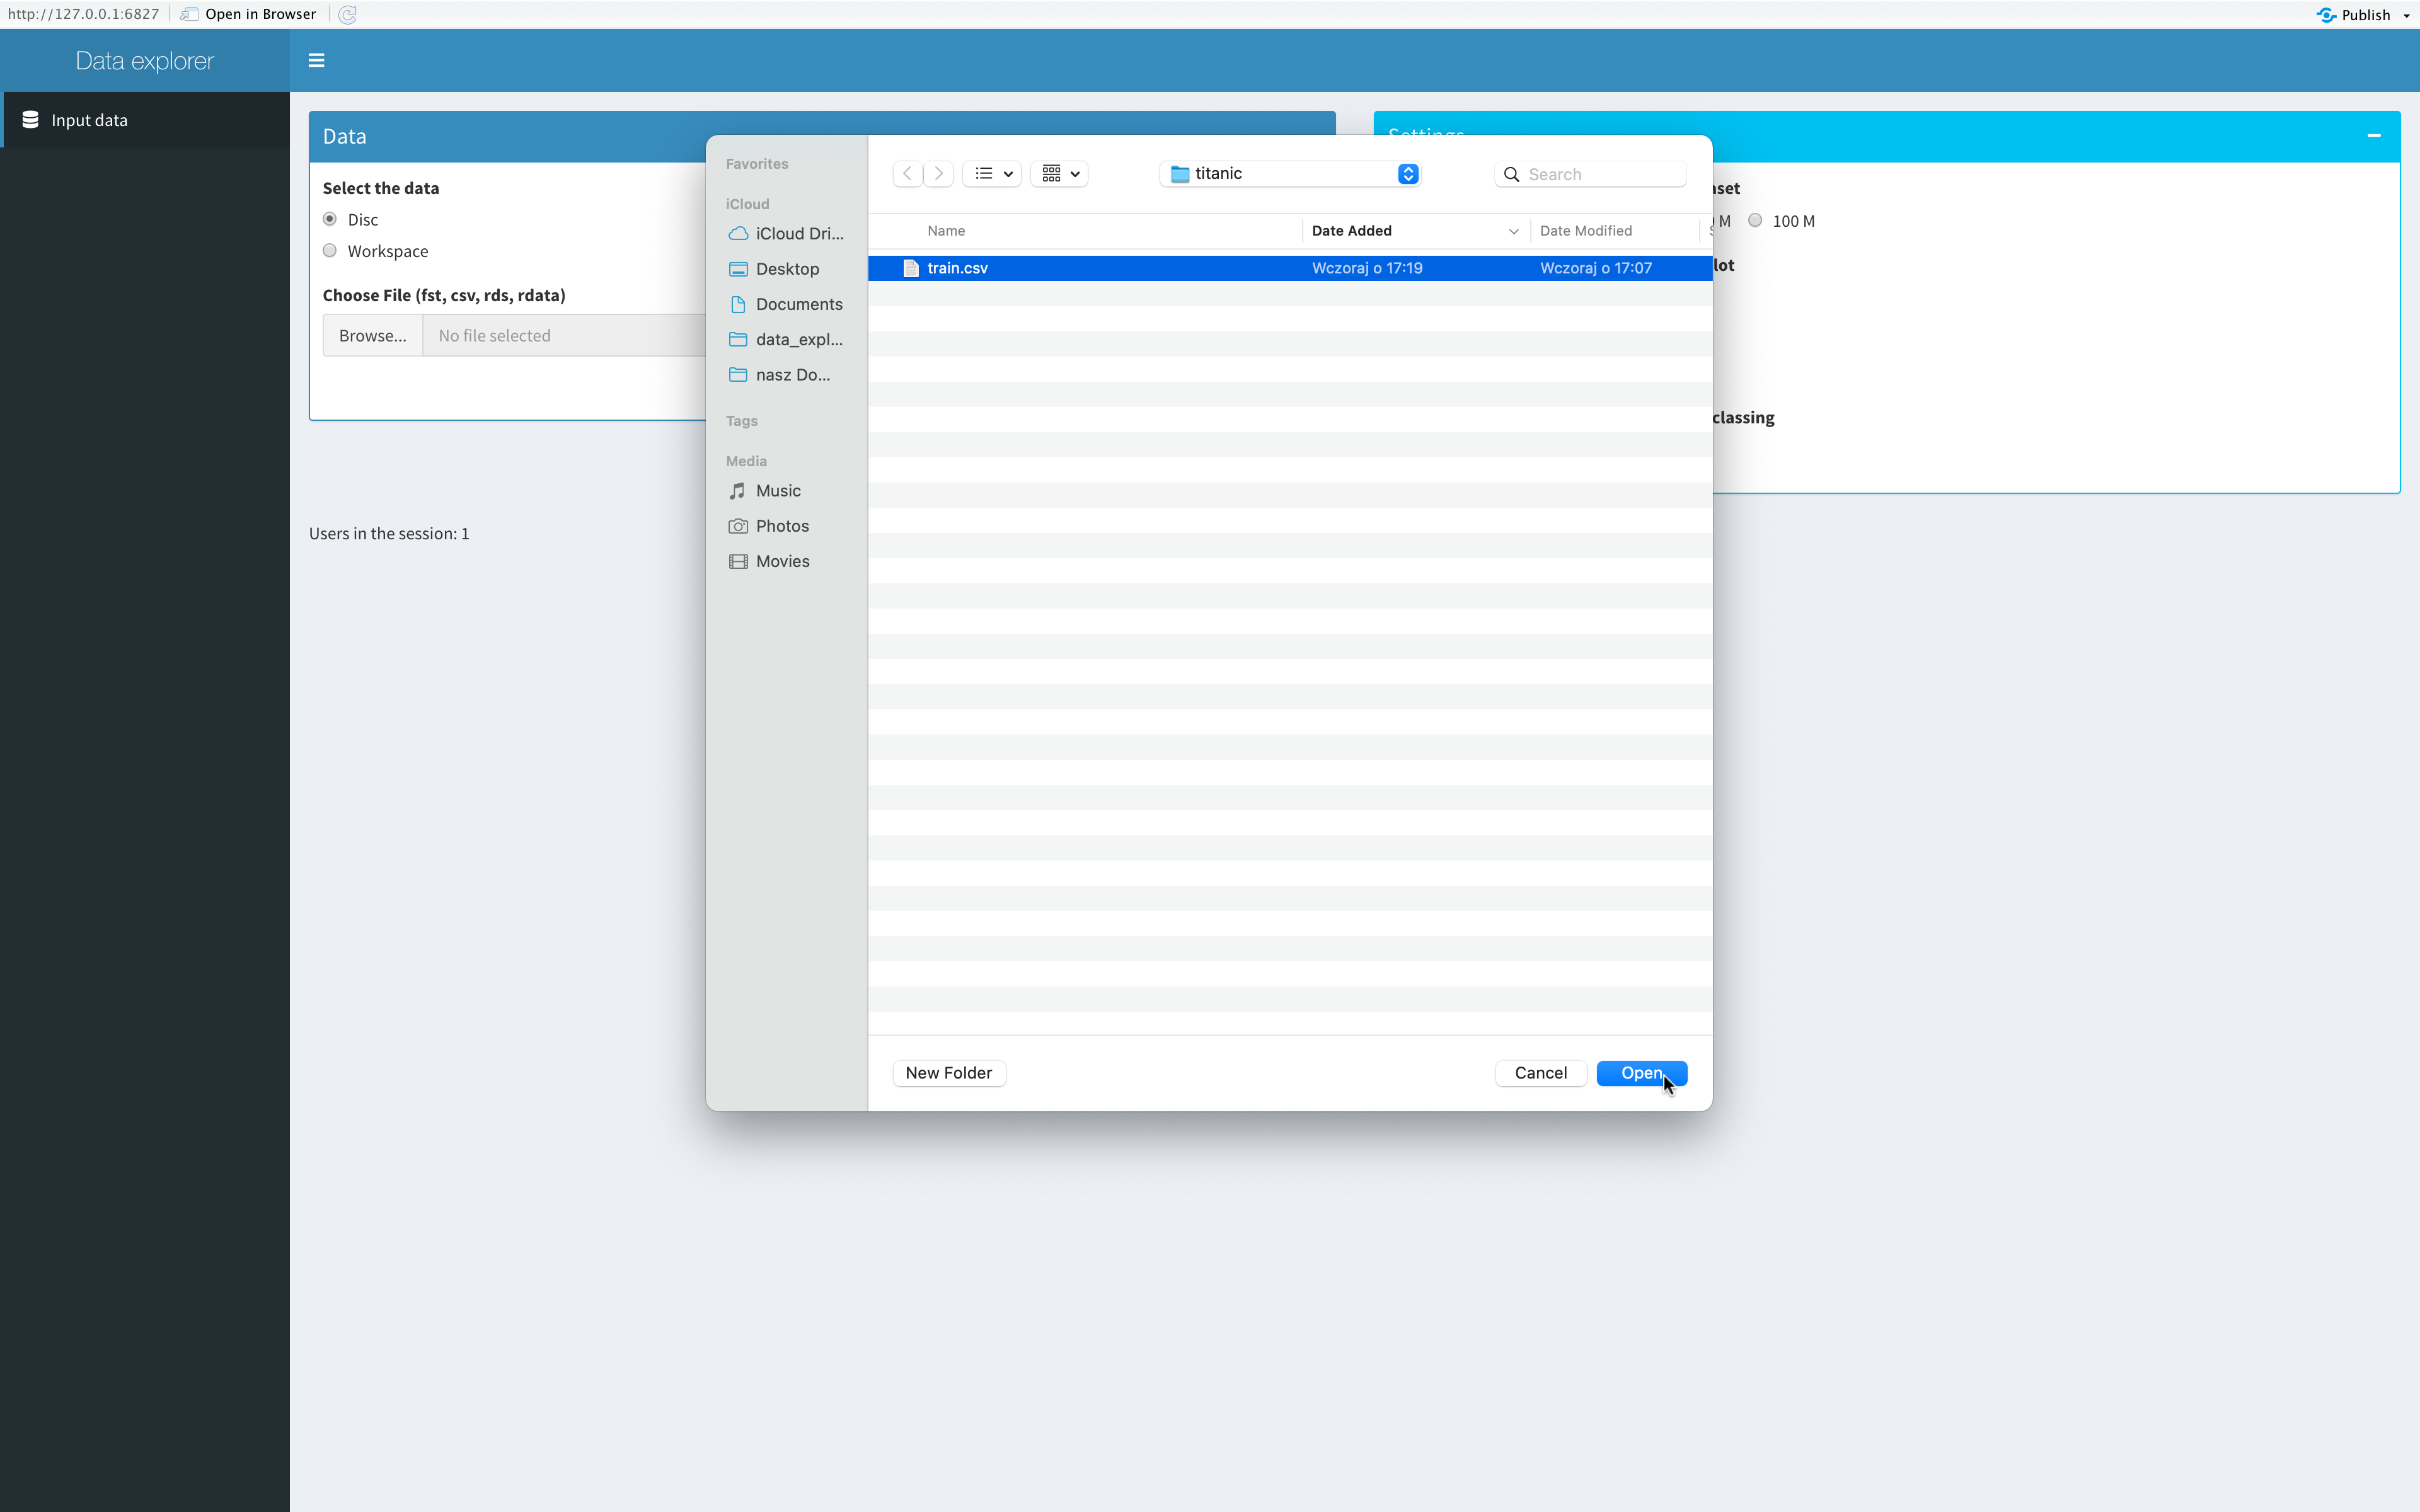
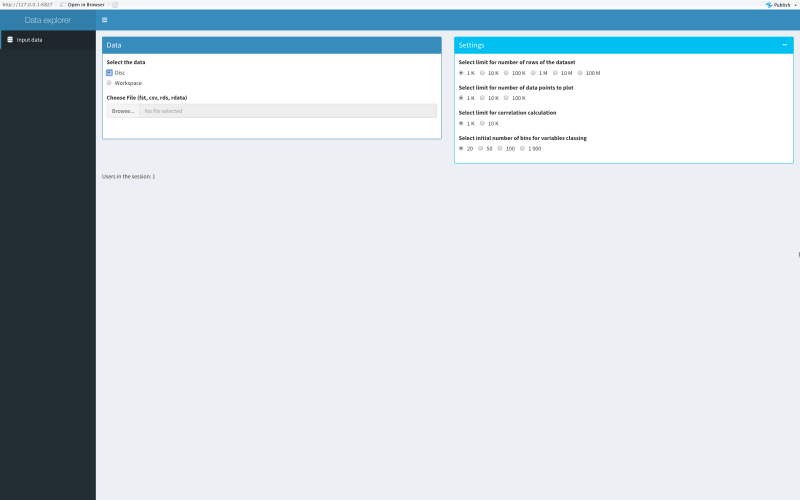
 Select "Disk" to browse for the data set.
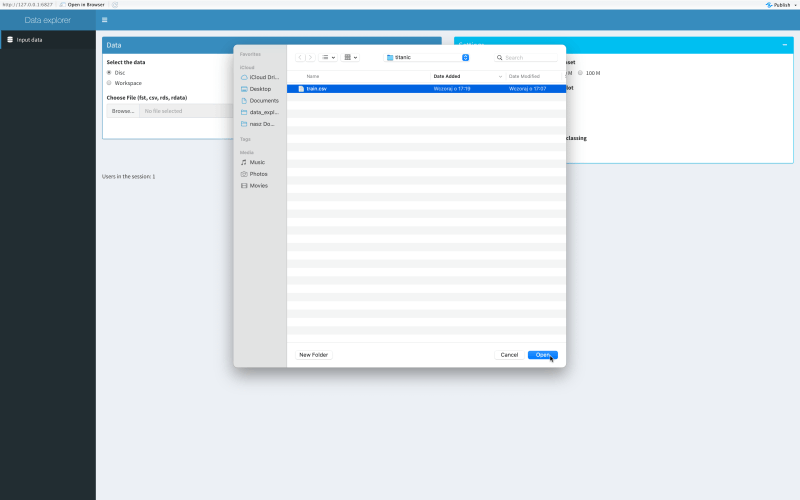 Select the data set from your drive.
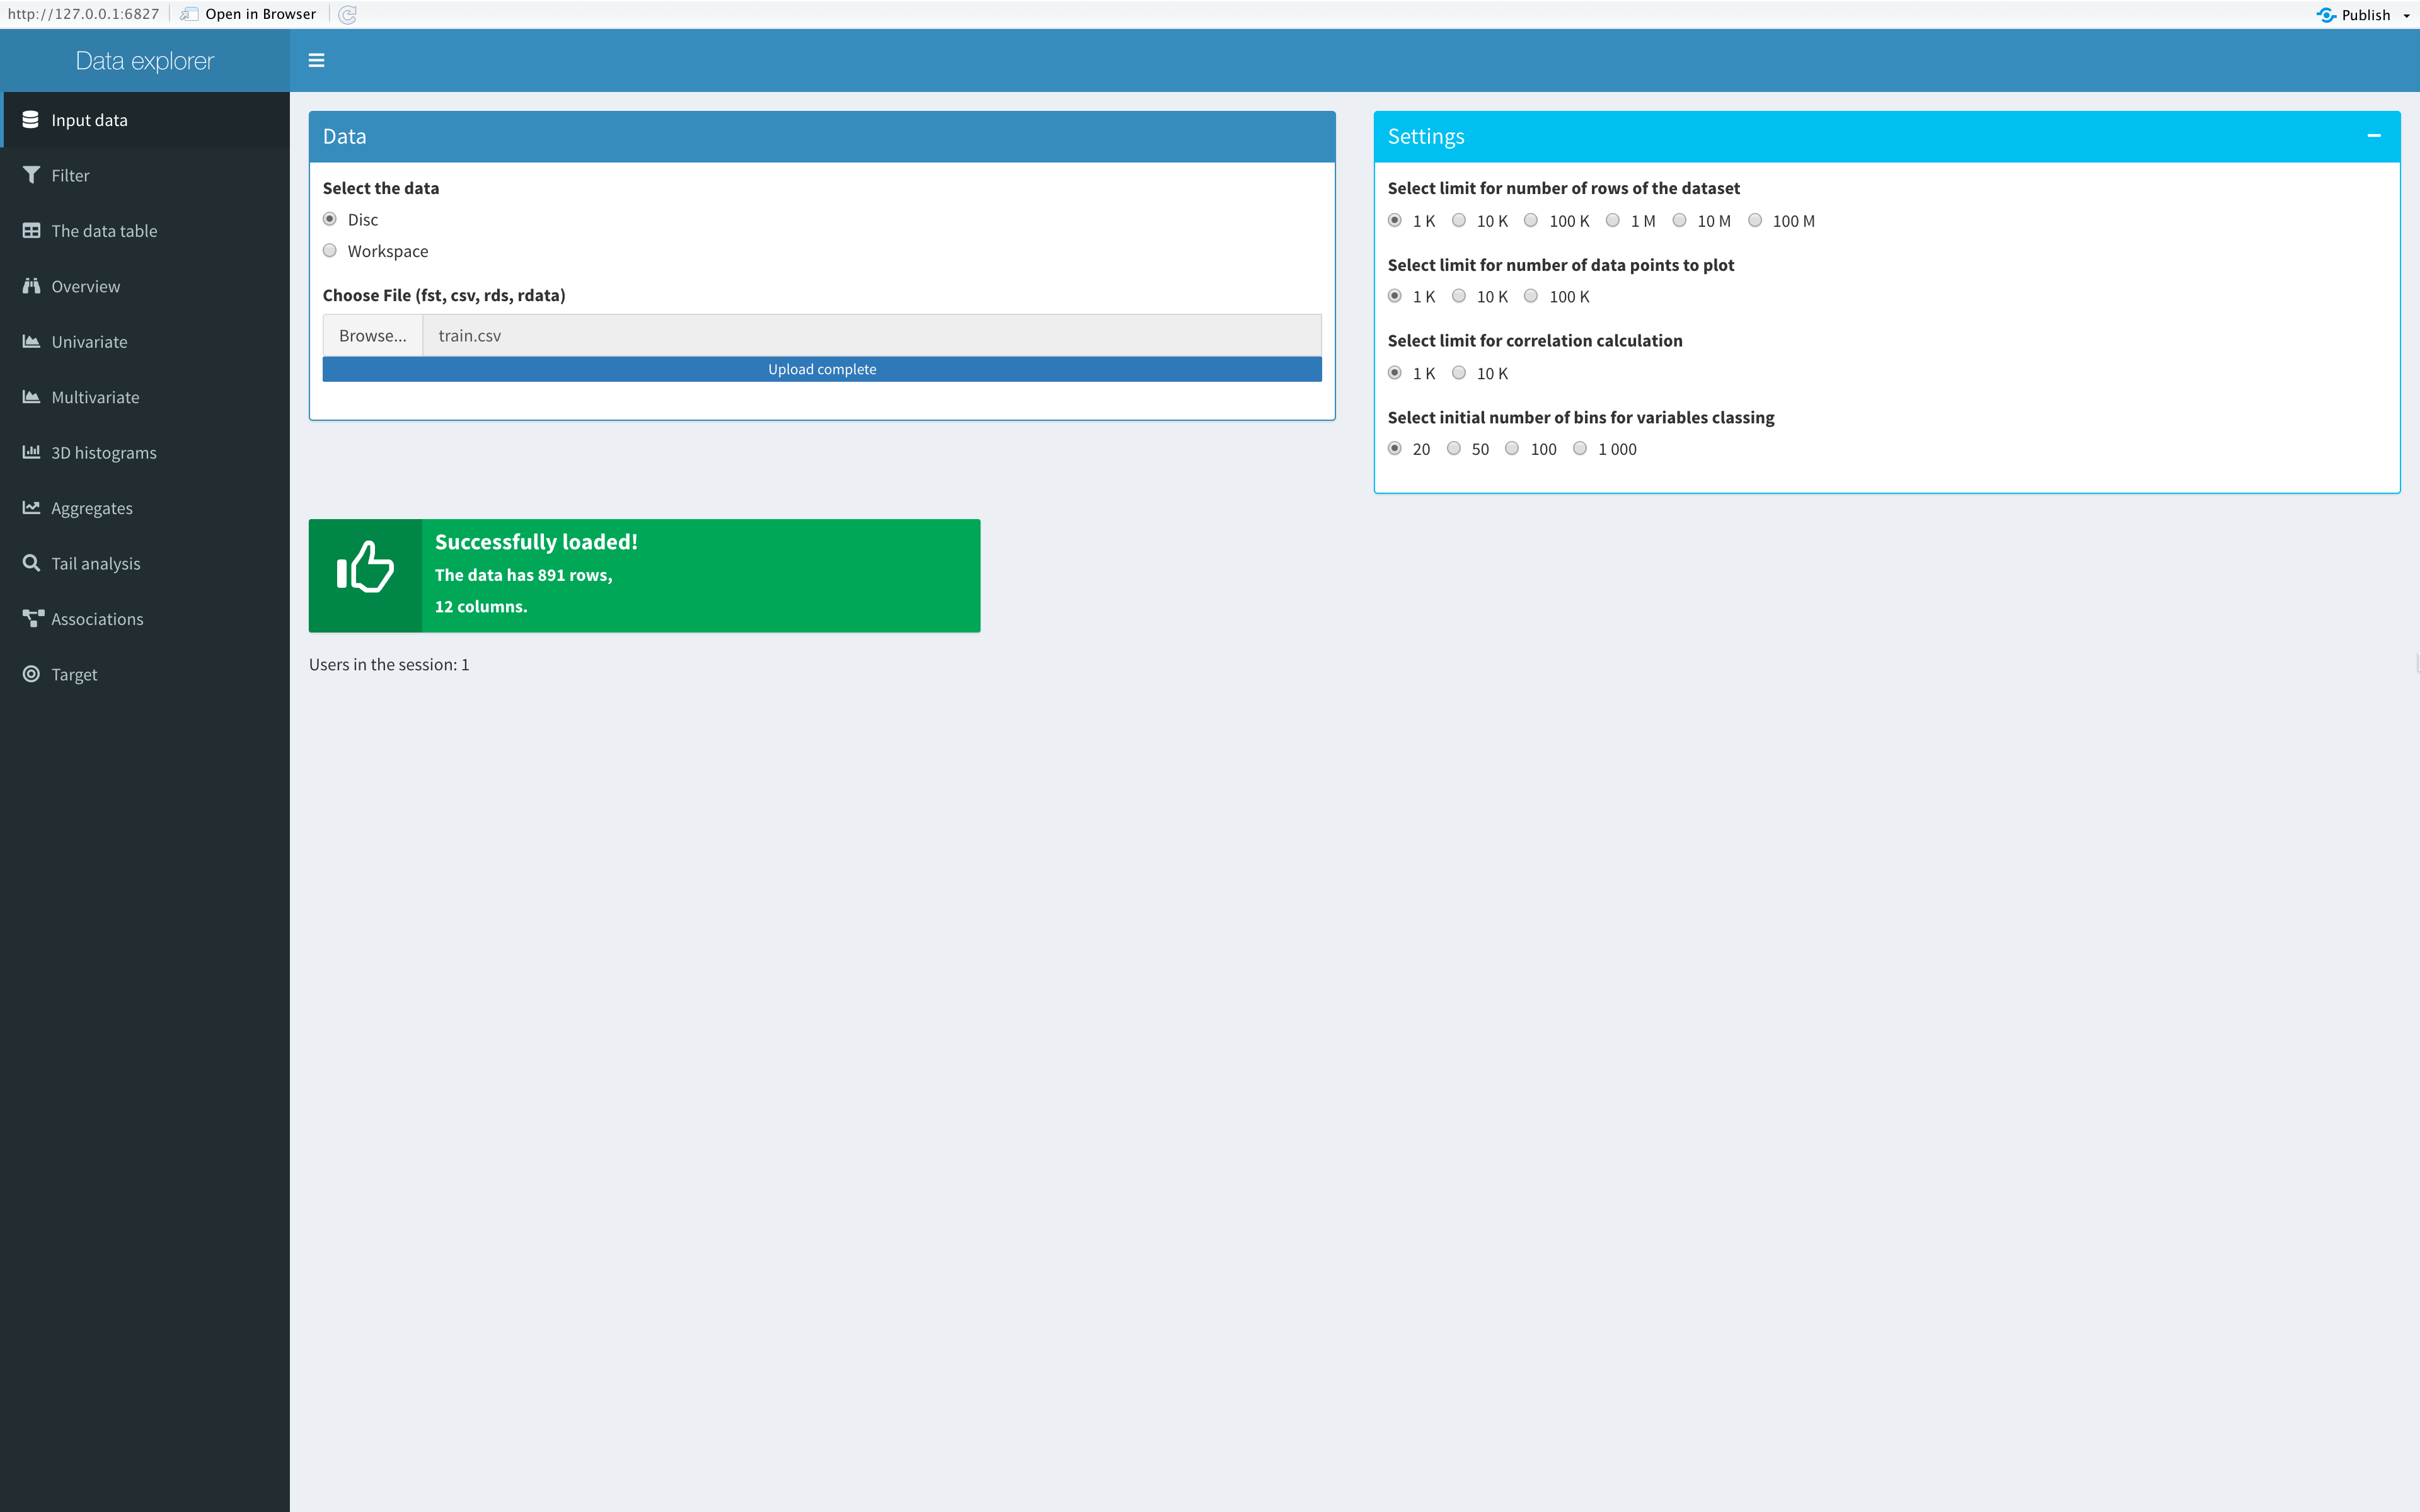
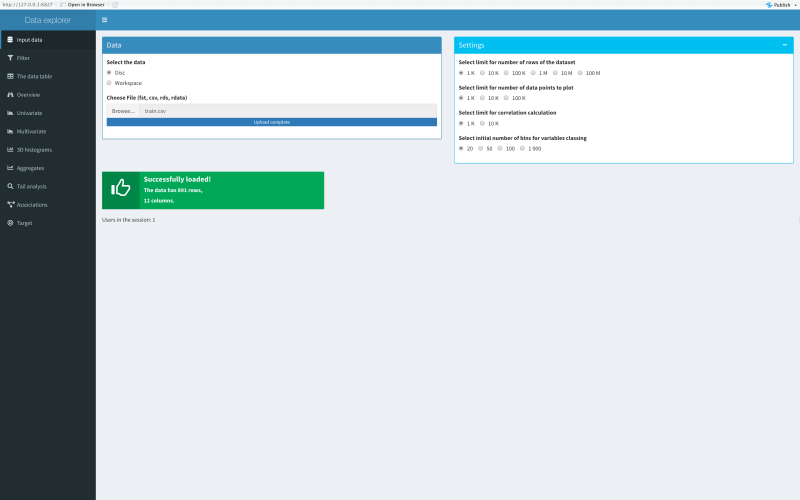 When data is loaded, short info about number of rows and columns is showed.
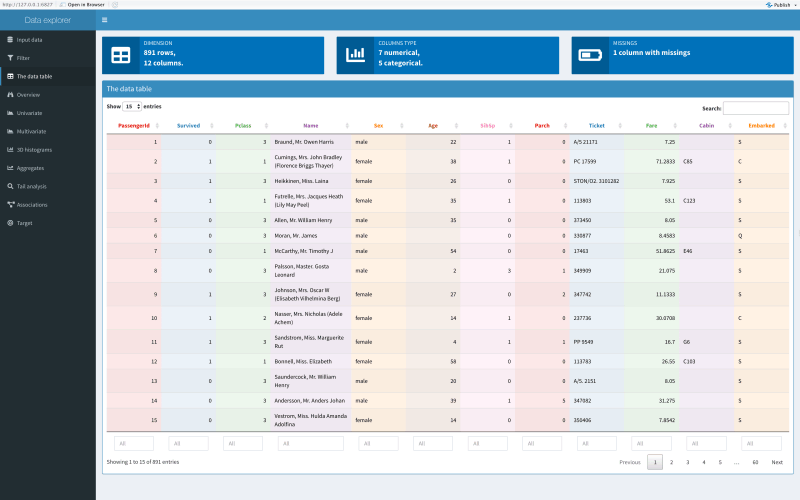 Data in table form presented.
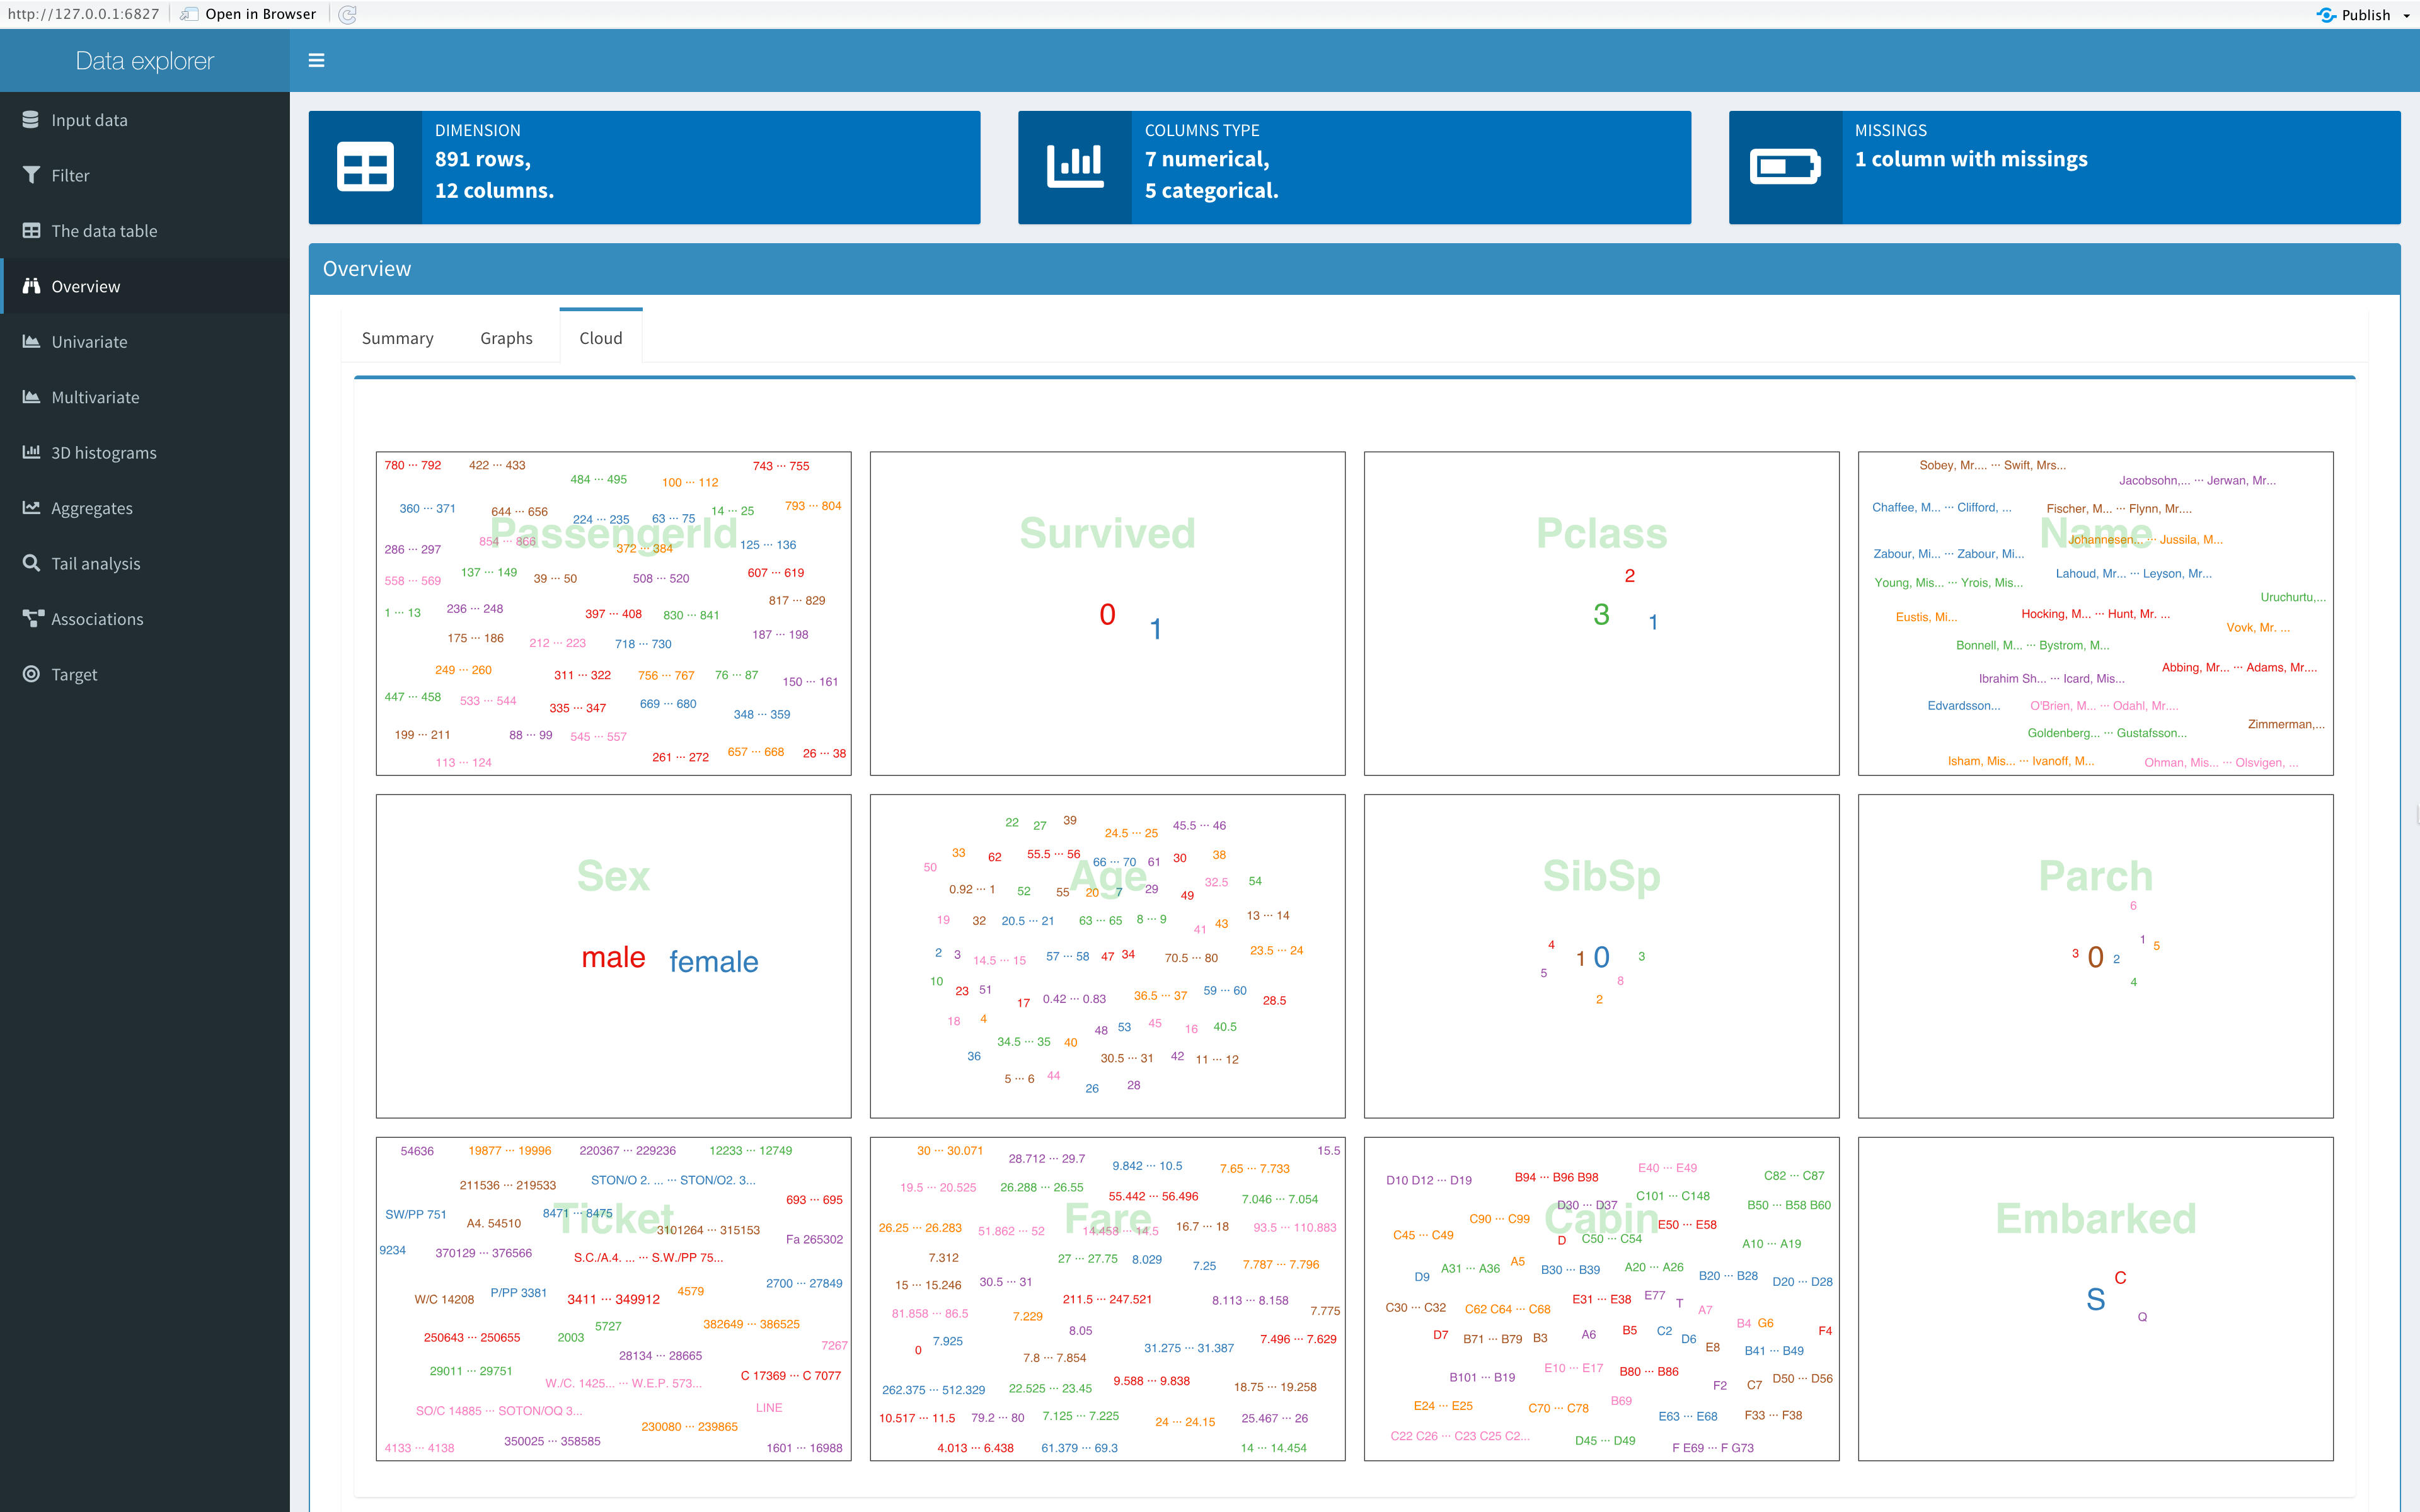
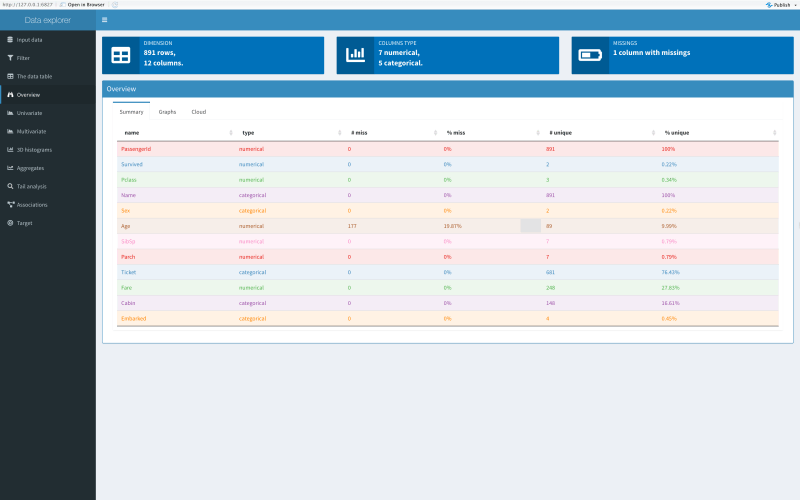 Overview summary info about columns: names, types, missings, uniques.
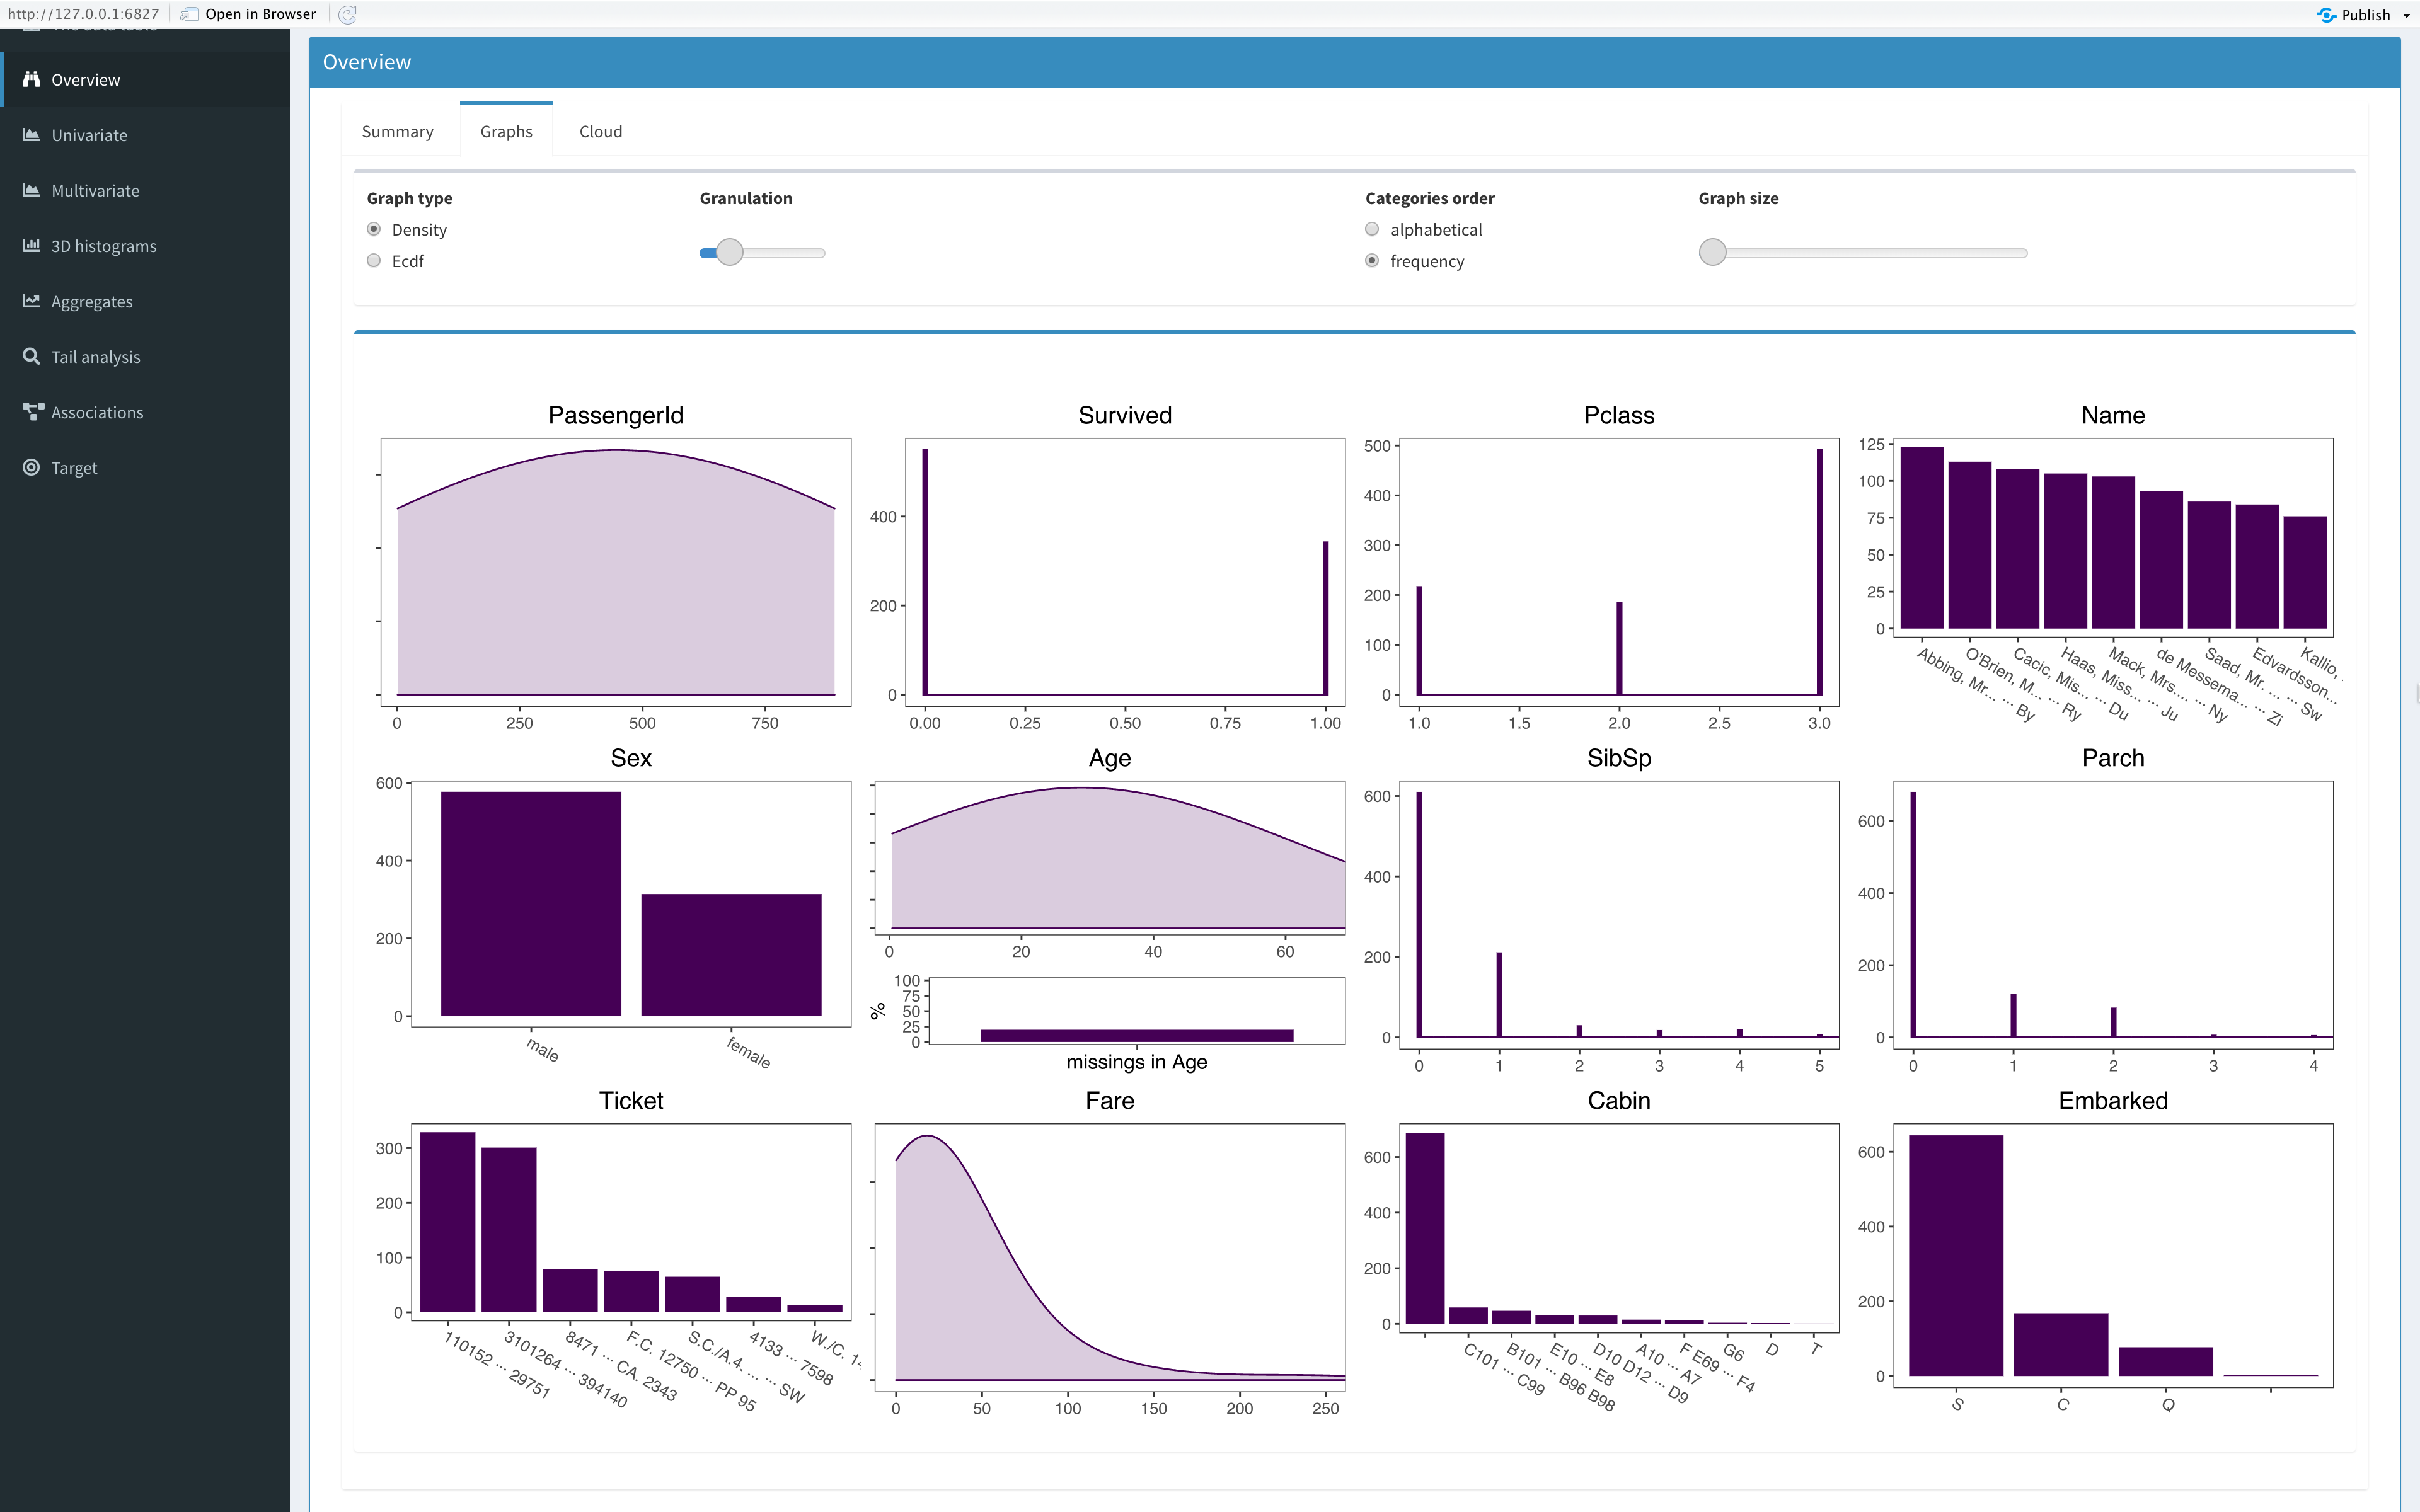
 Densities of all the columns.
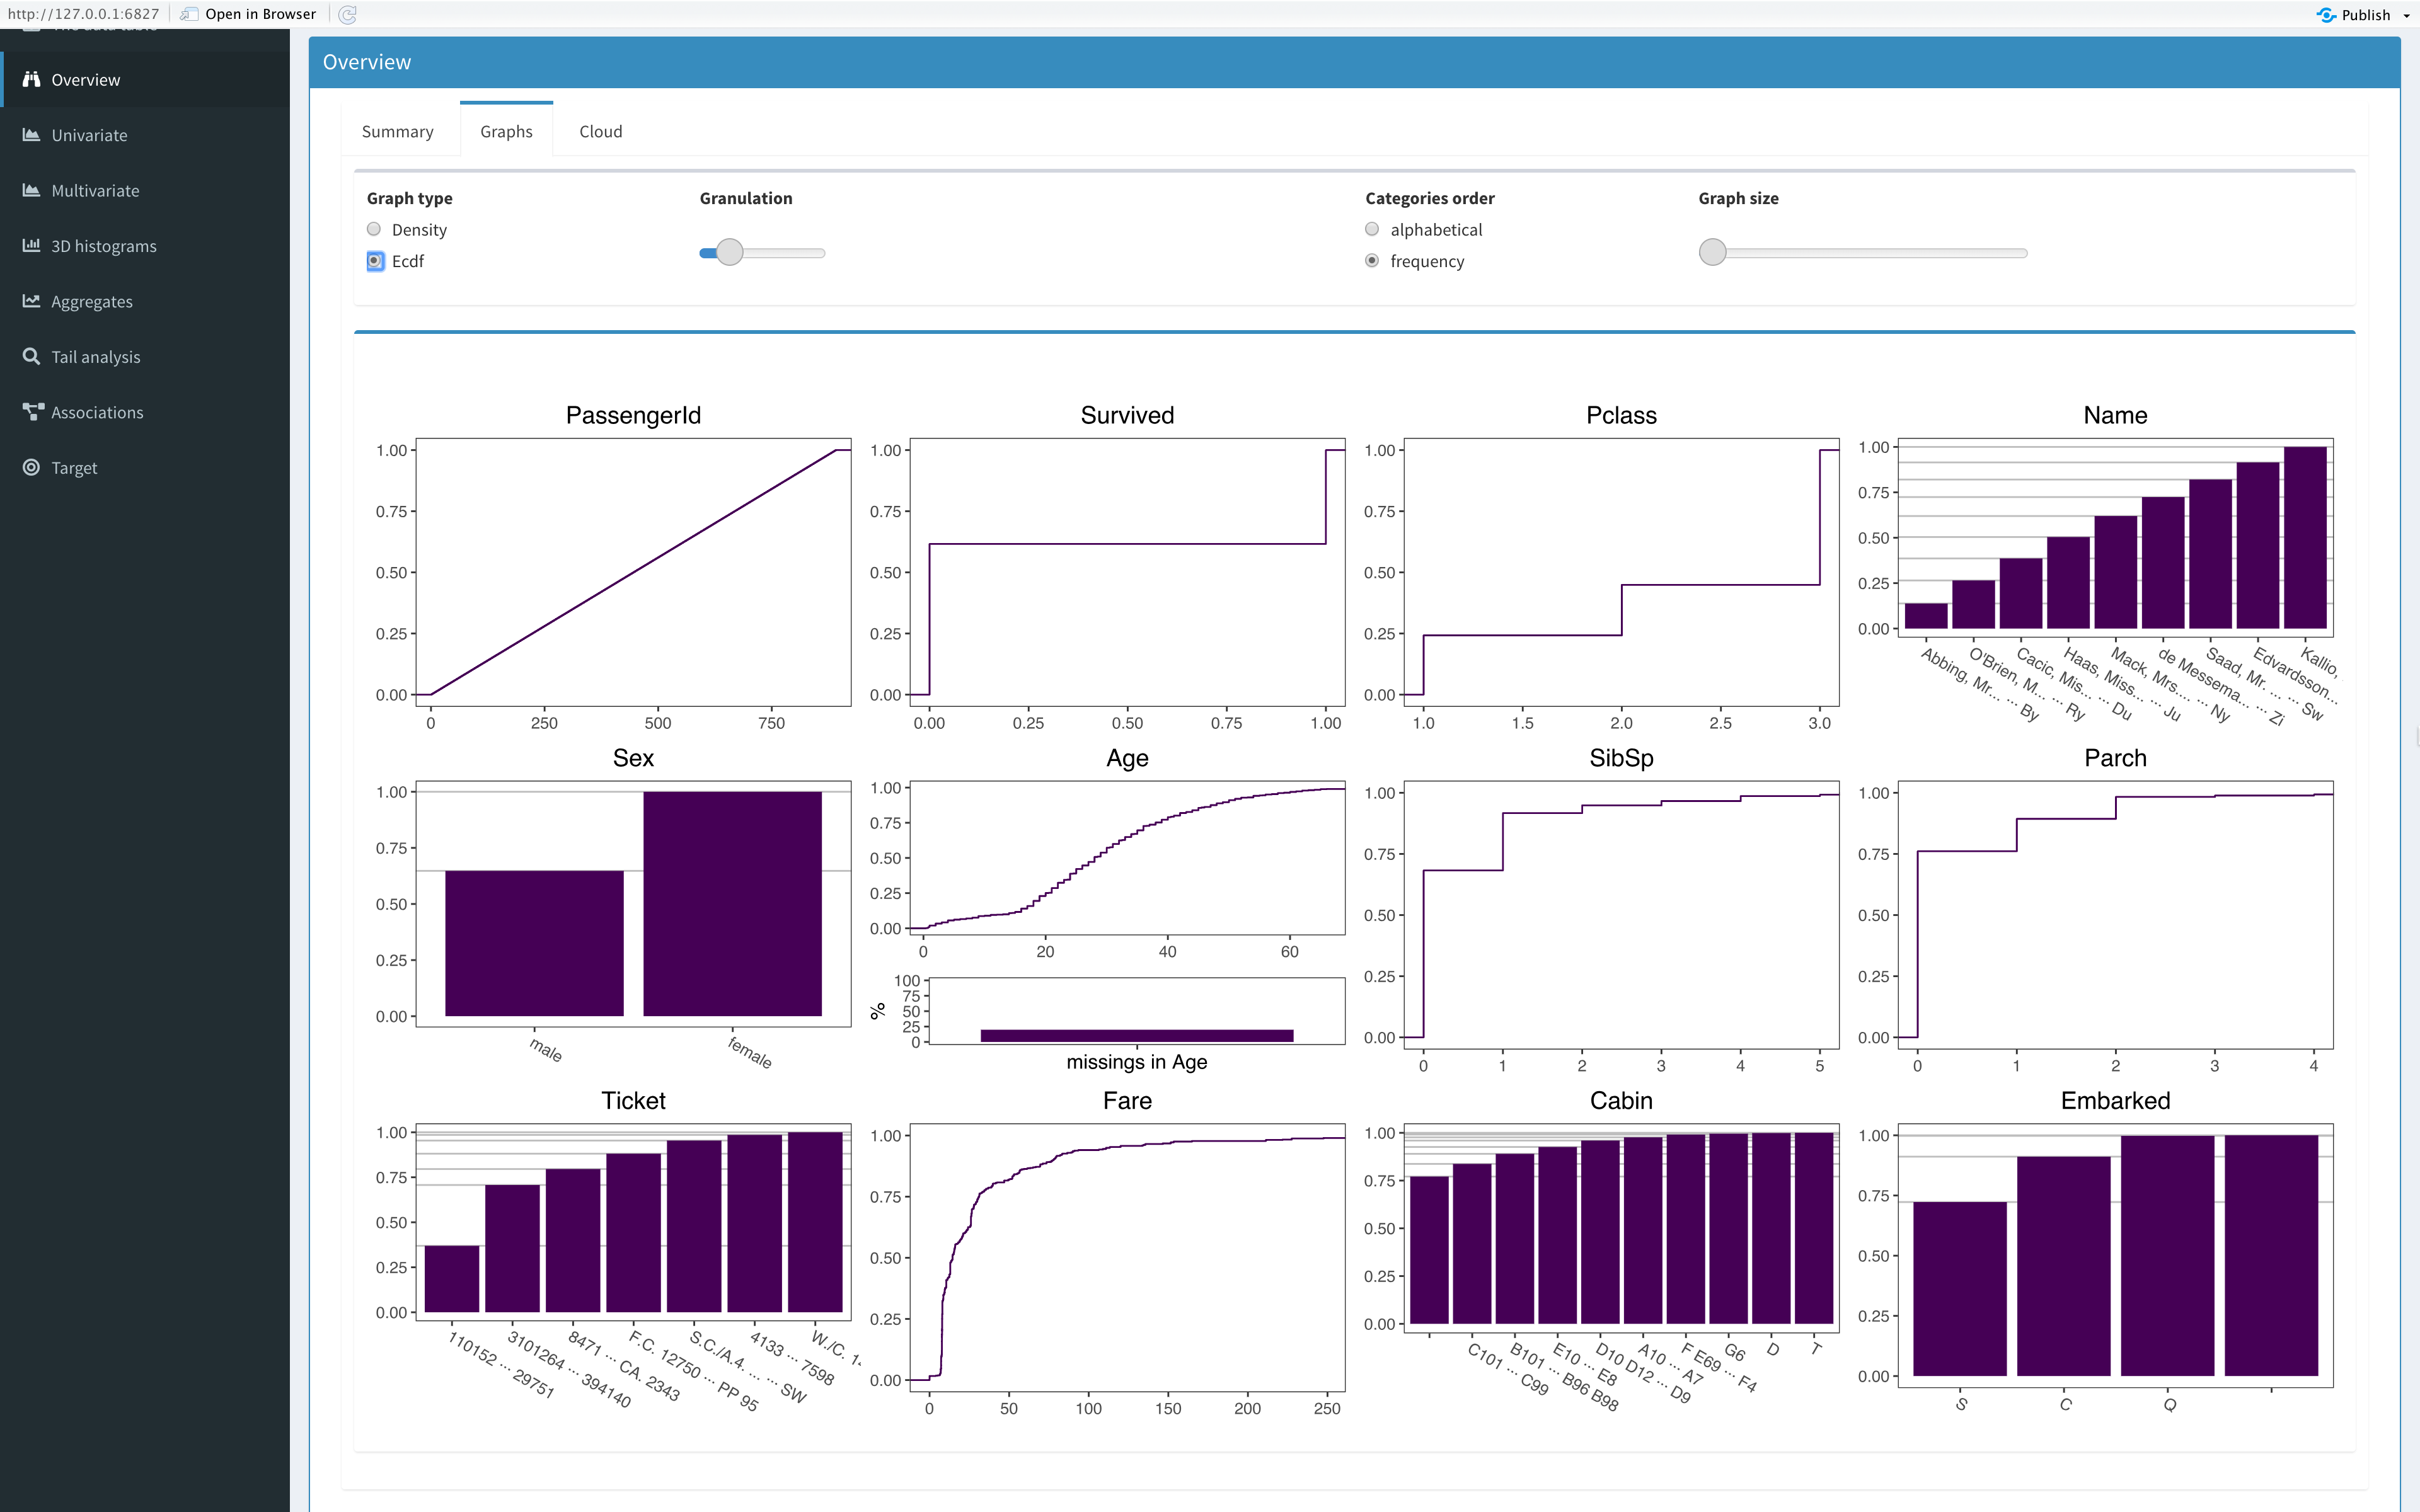
 Empirical cumulative distribution functions for all the columns.
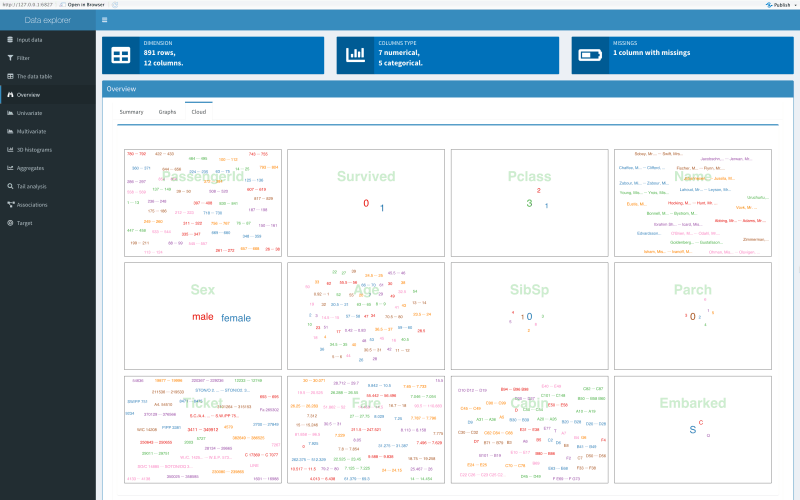 Clouds.
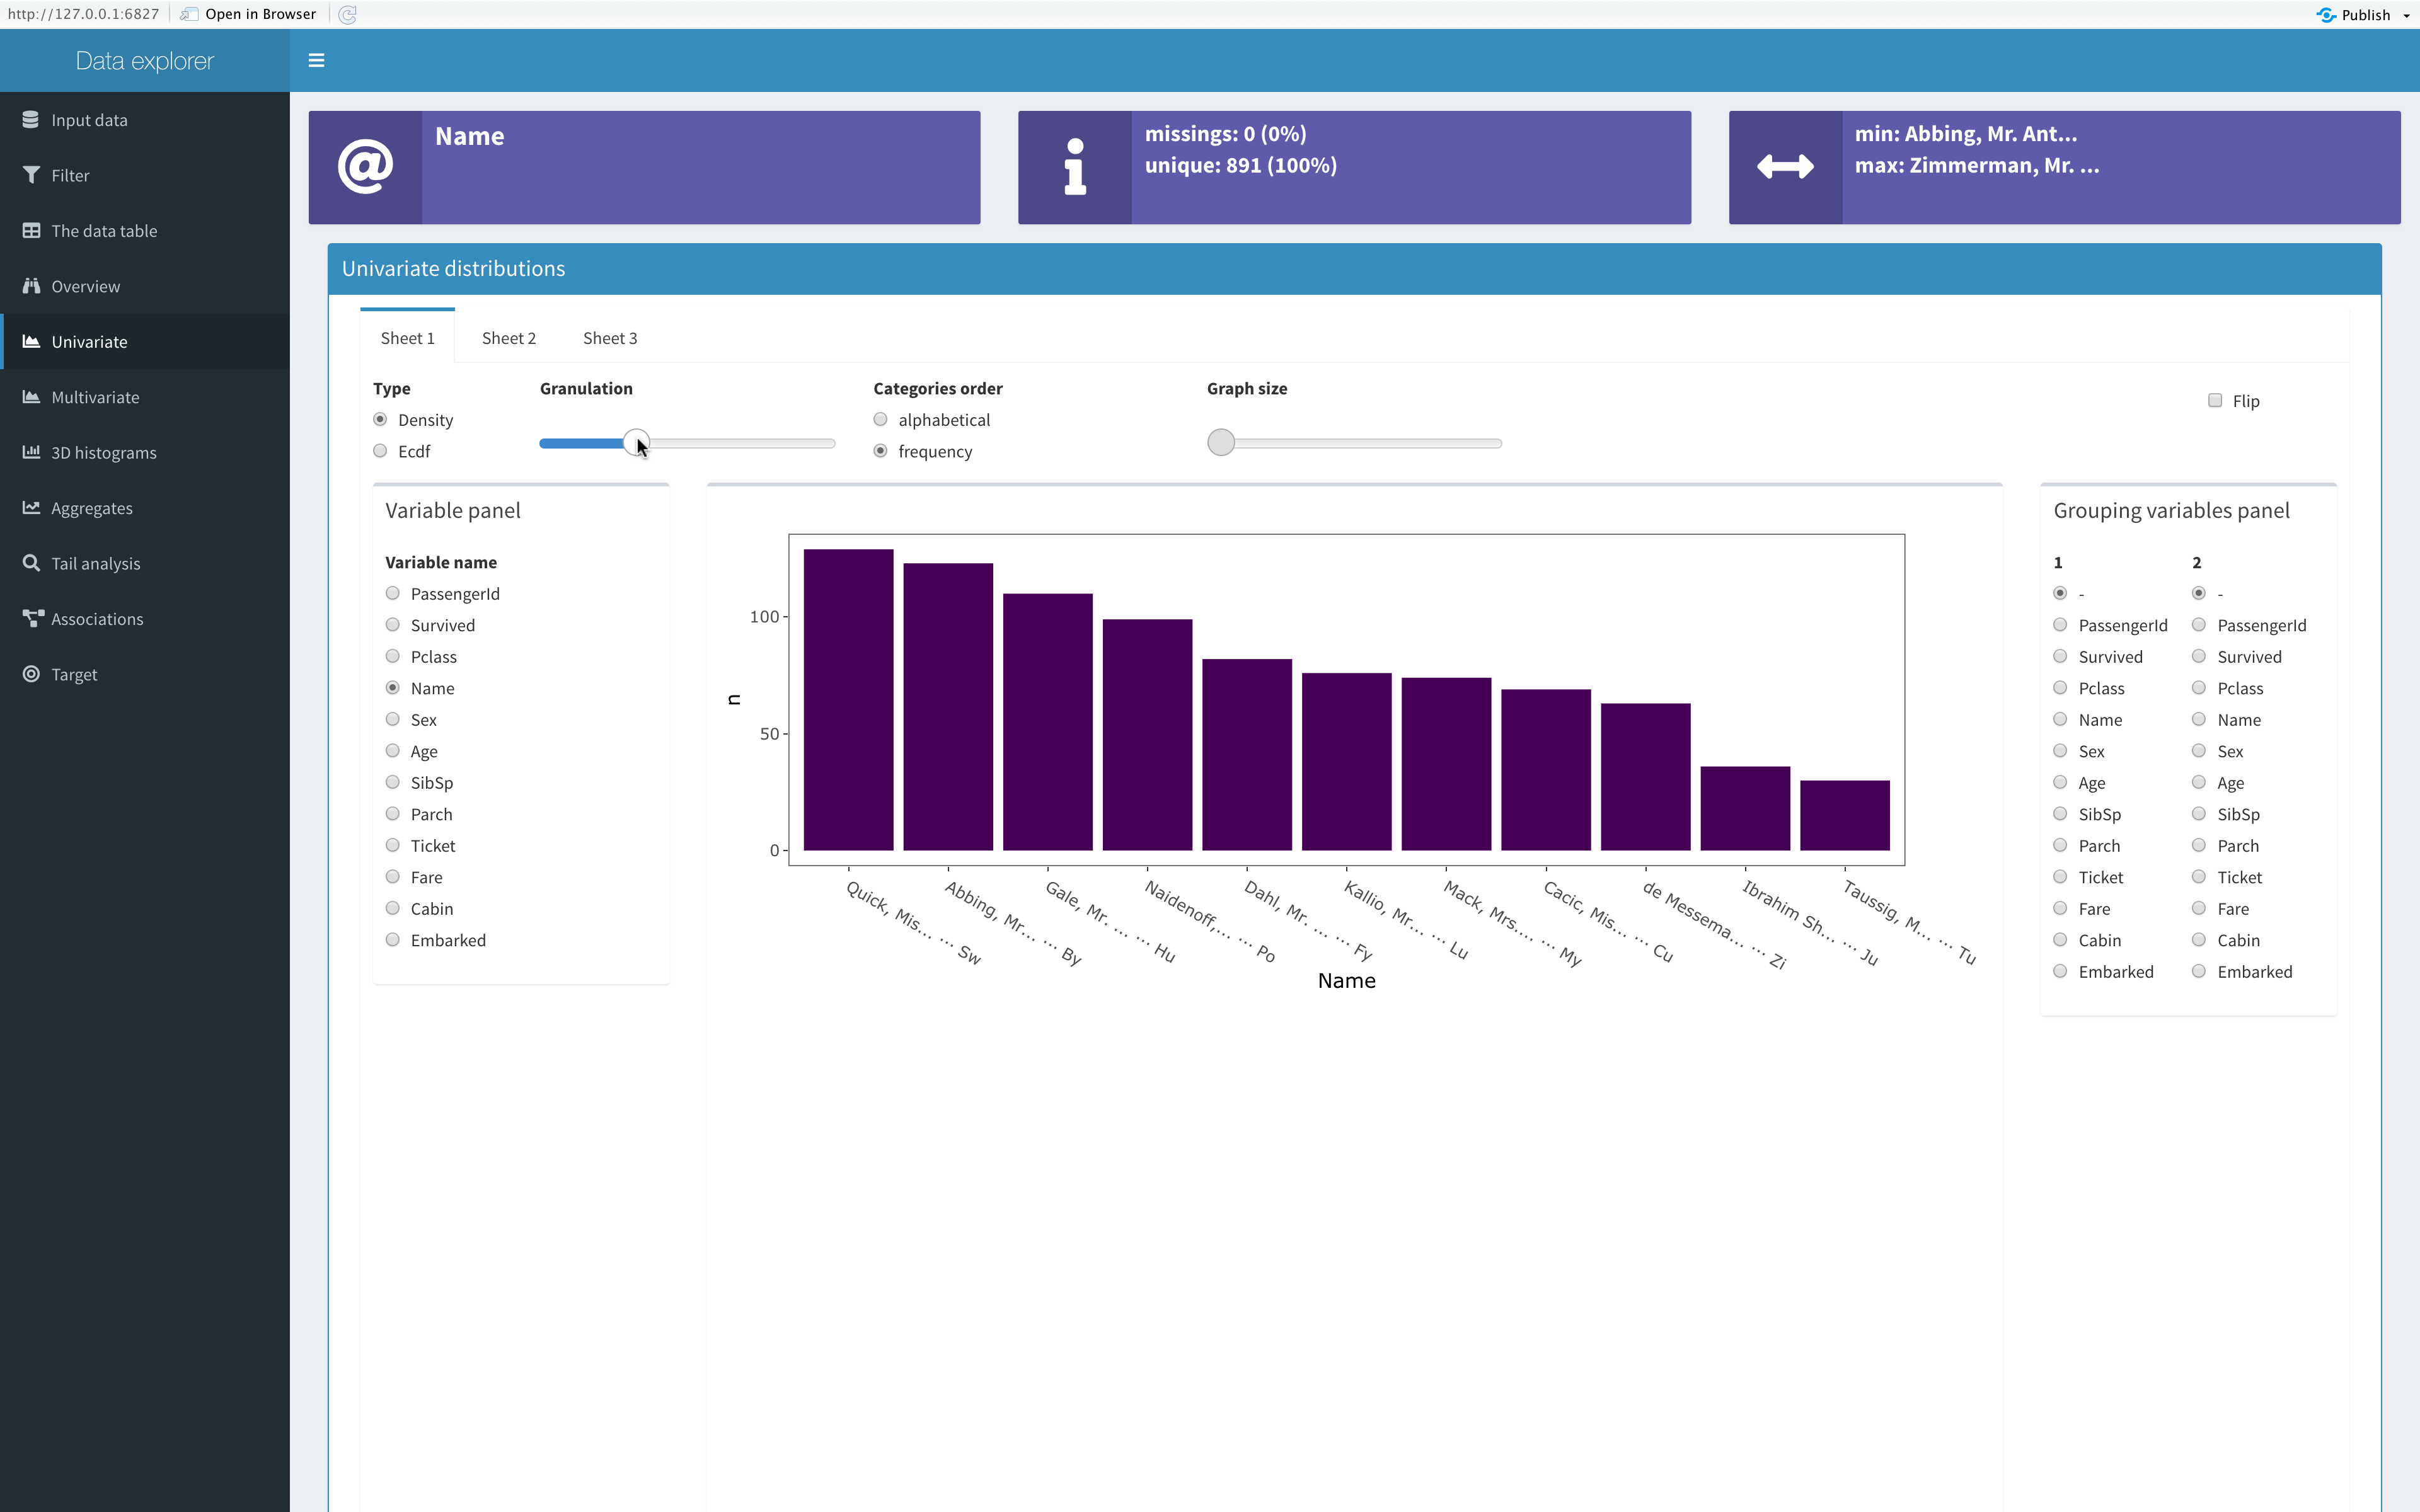
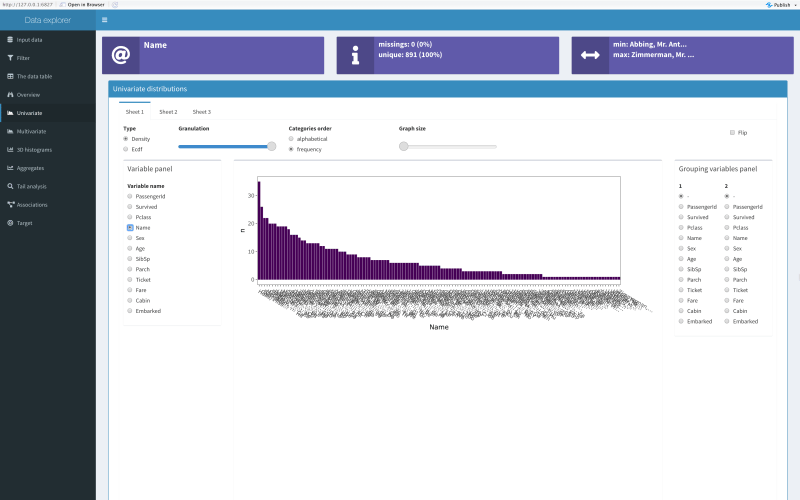 Univariate density (histogram) of name (granulation set by the slider)
 Univariate density (histogram) of name (granulation set by the slider)
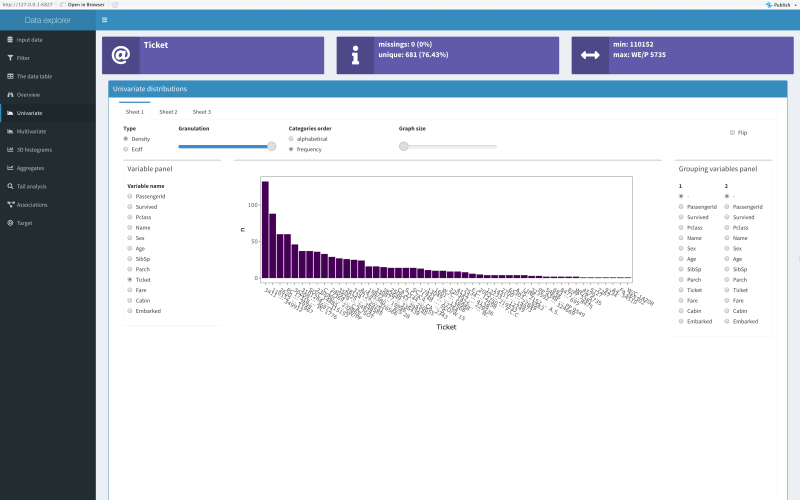 Univariate density (histogram) of ticket (granulation set by the slider)
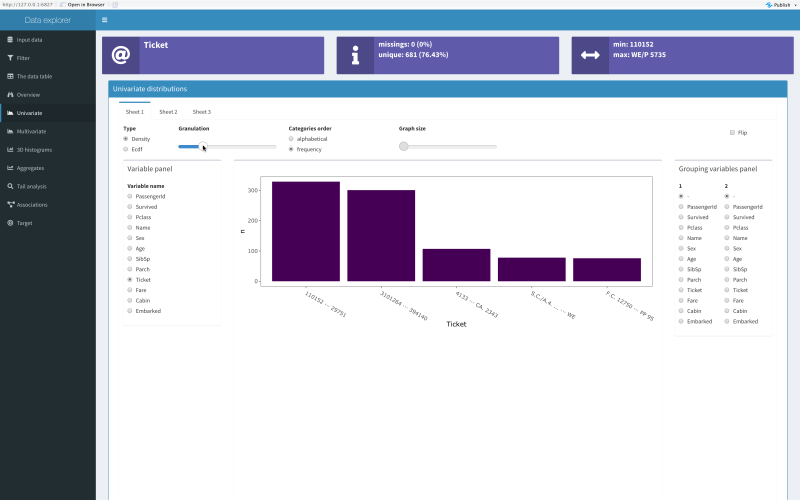 Univariate density (histogram) of ticket (granulation set by the slider)
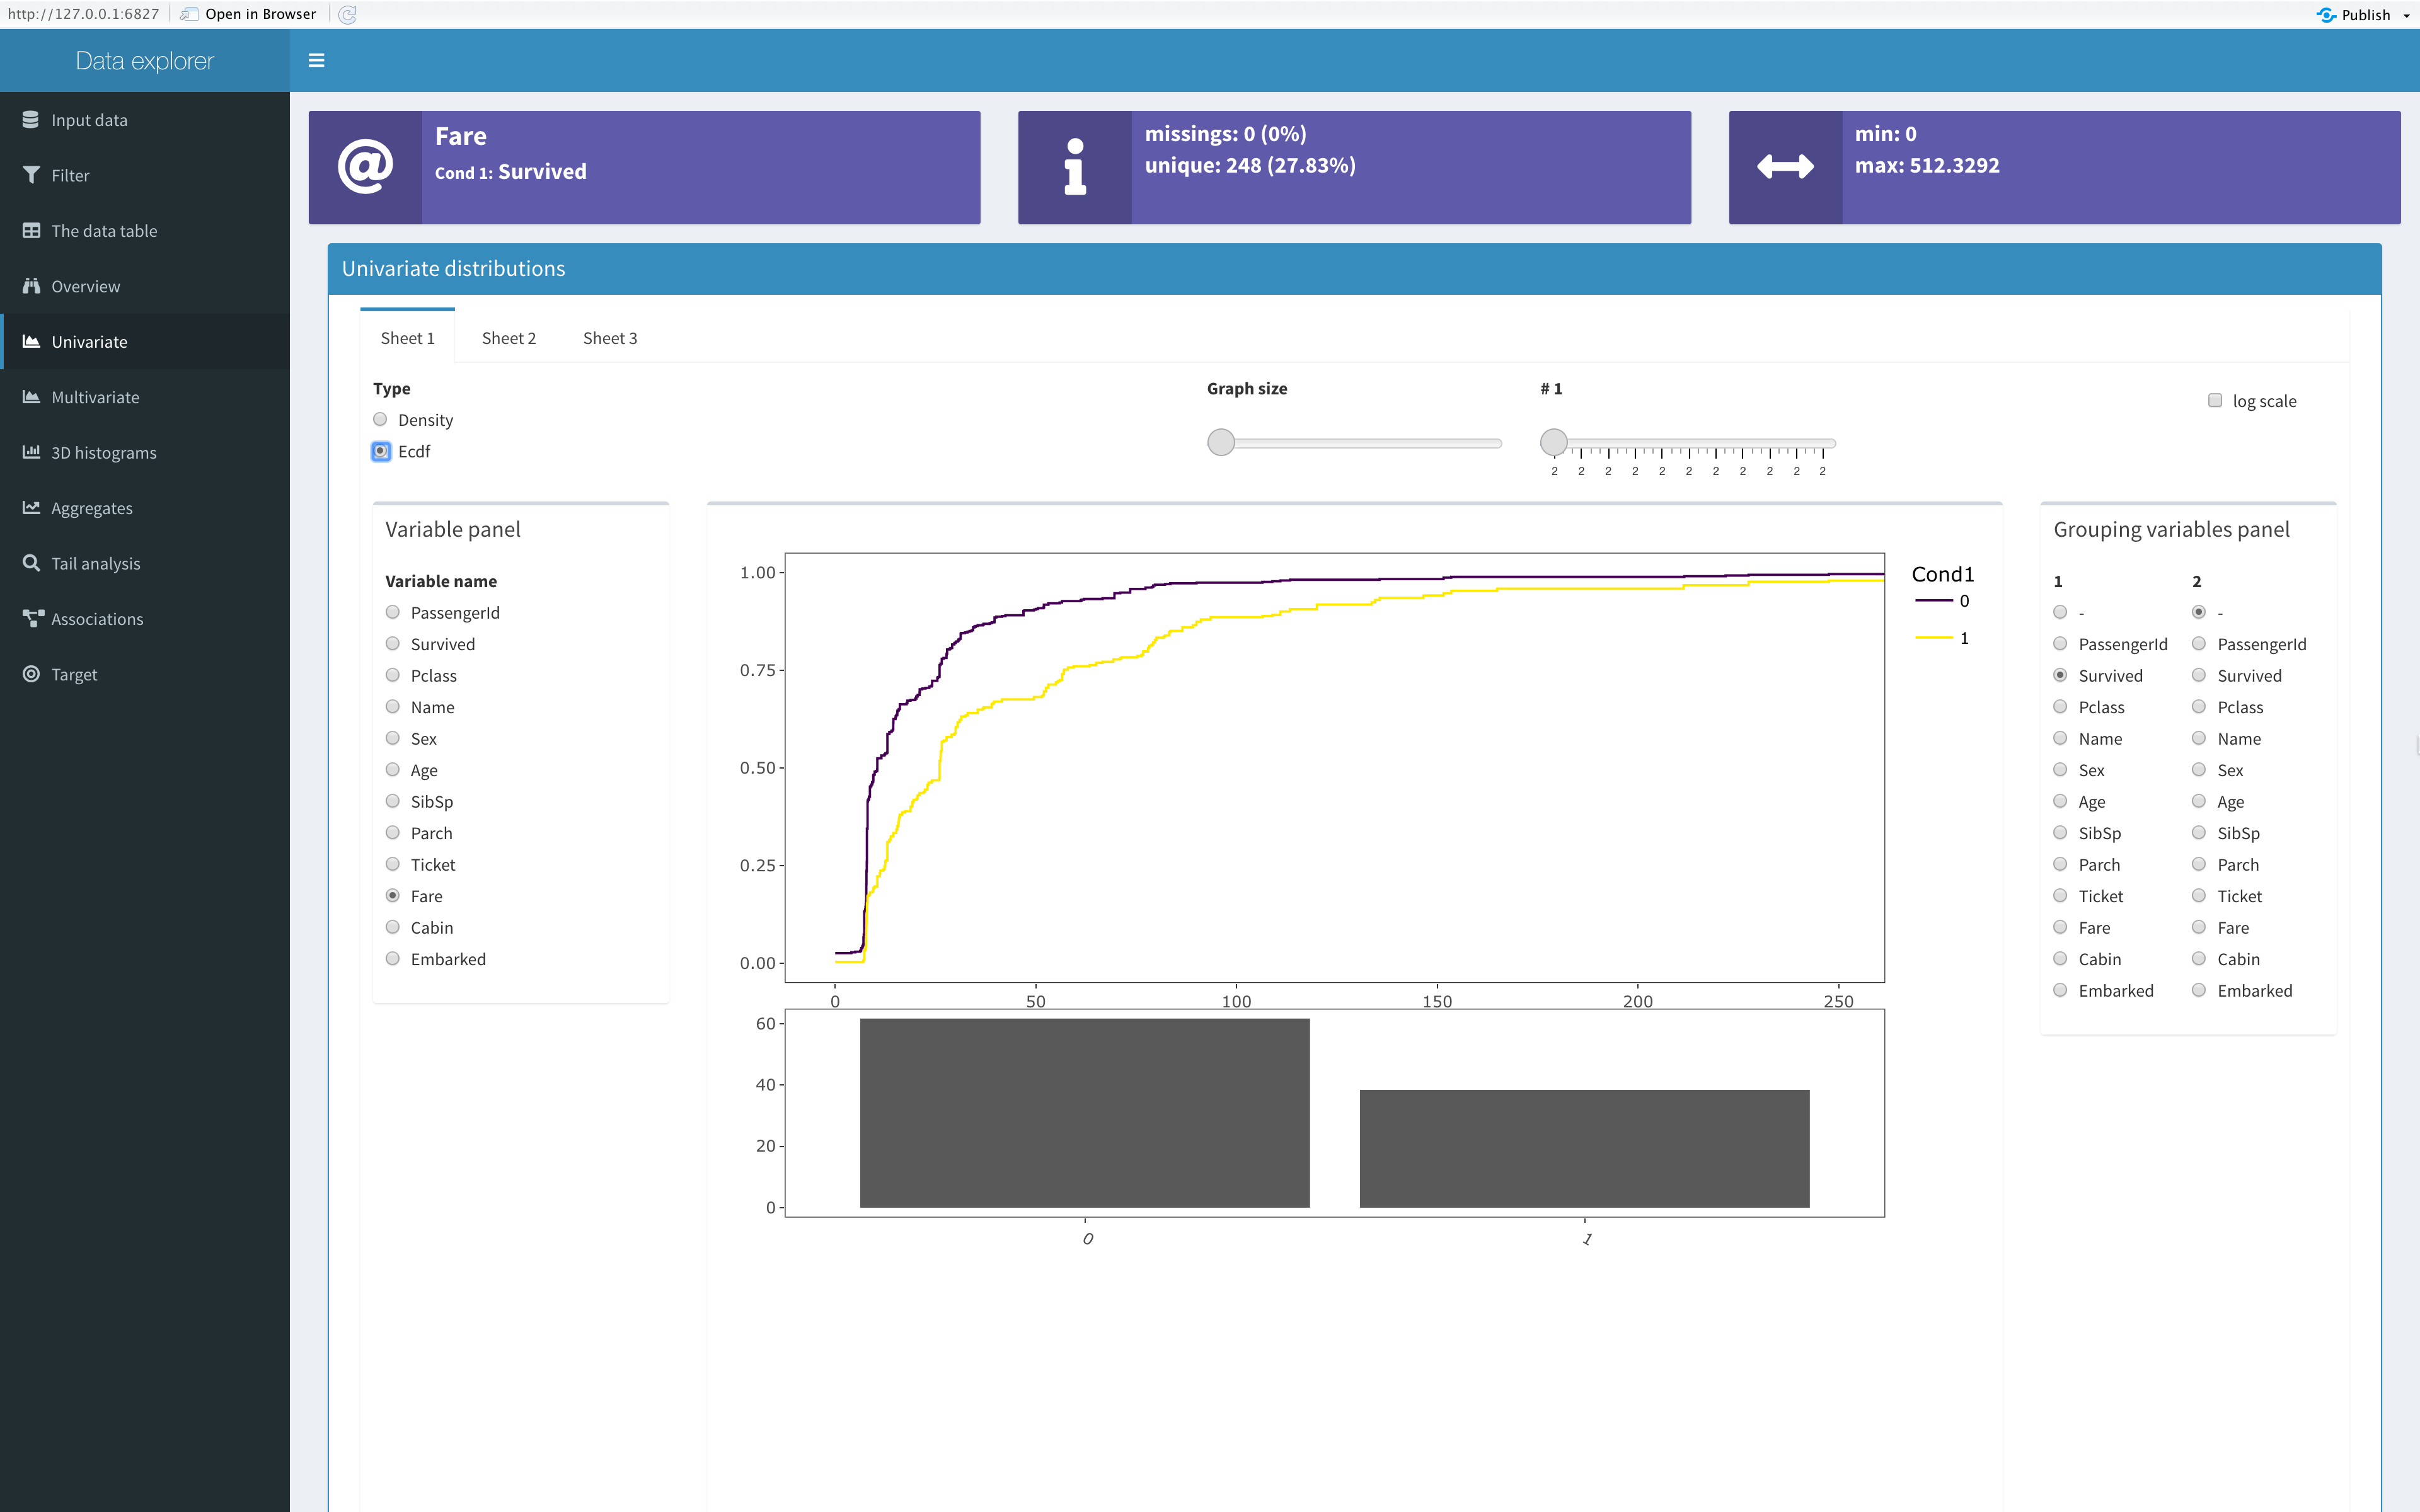
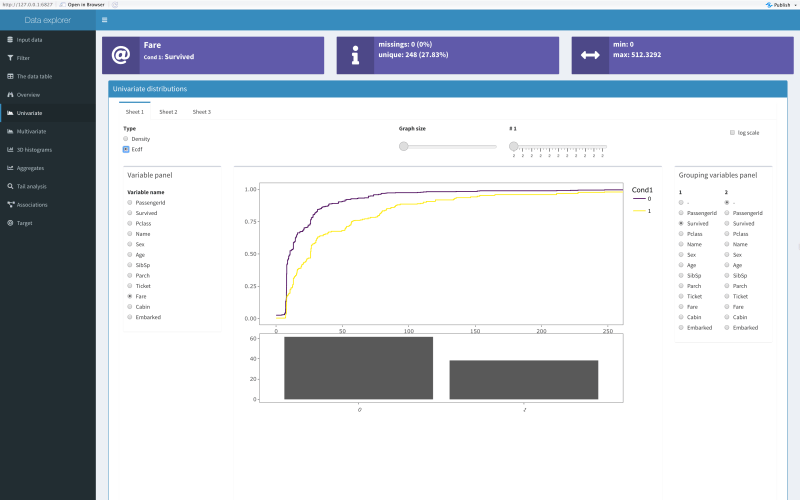 Empirical cumulative distribution function for fare grouped by survive indicator
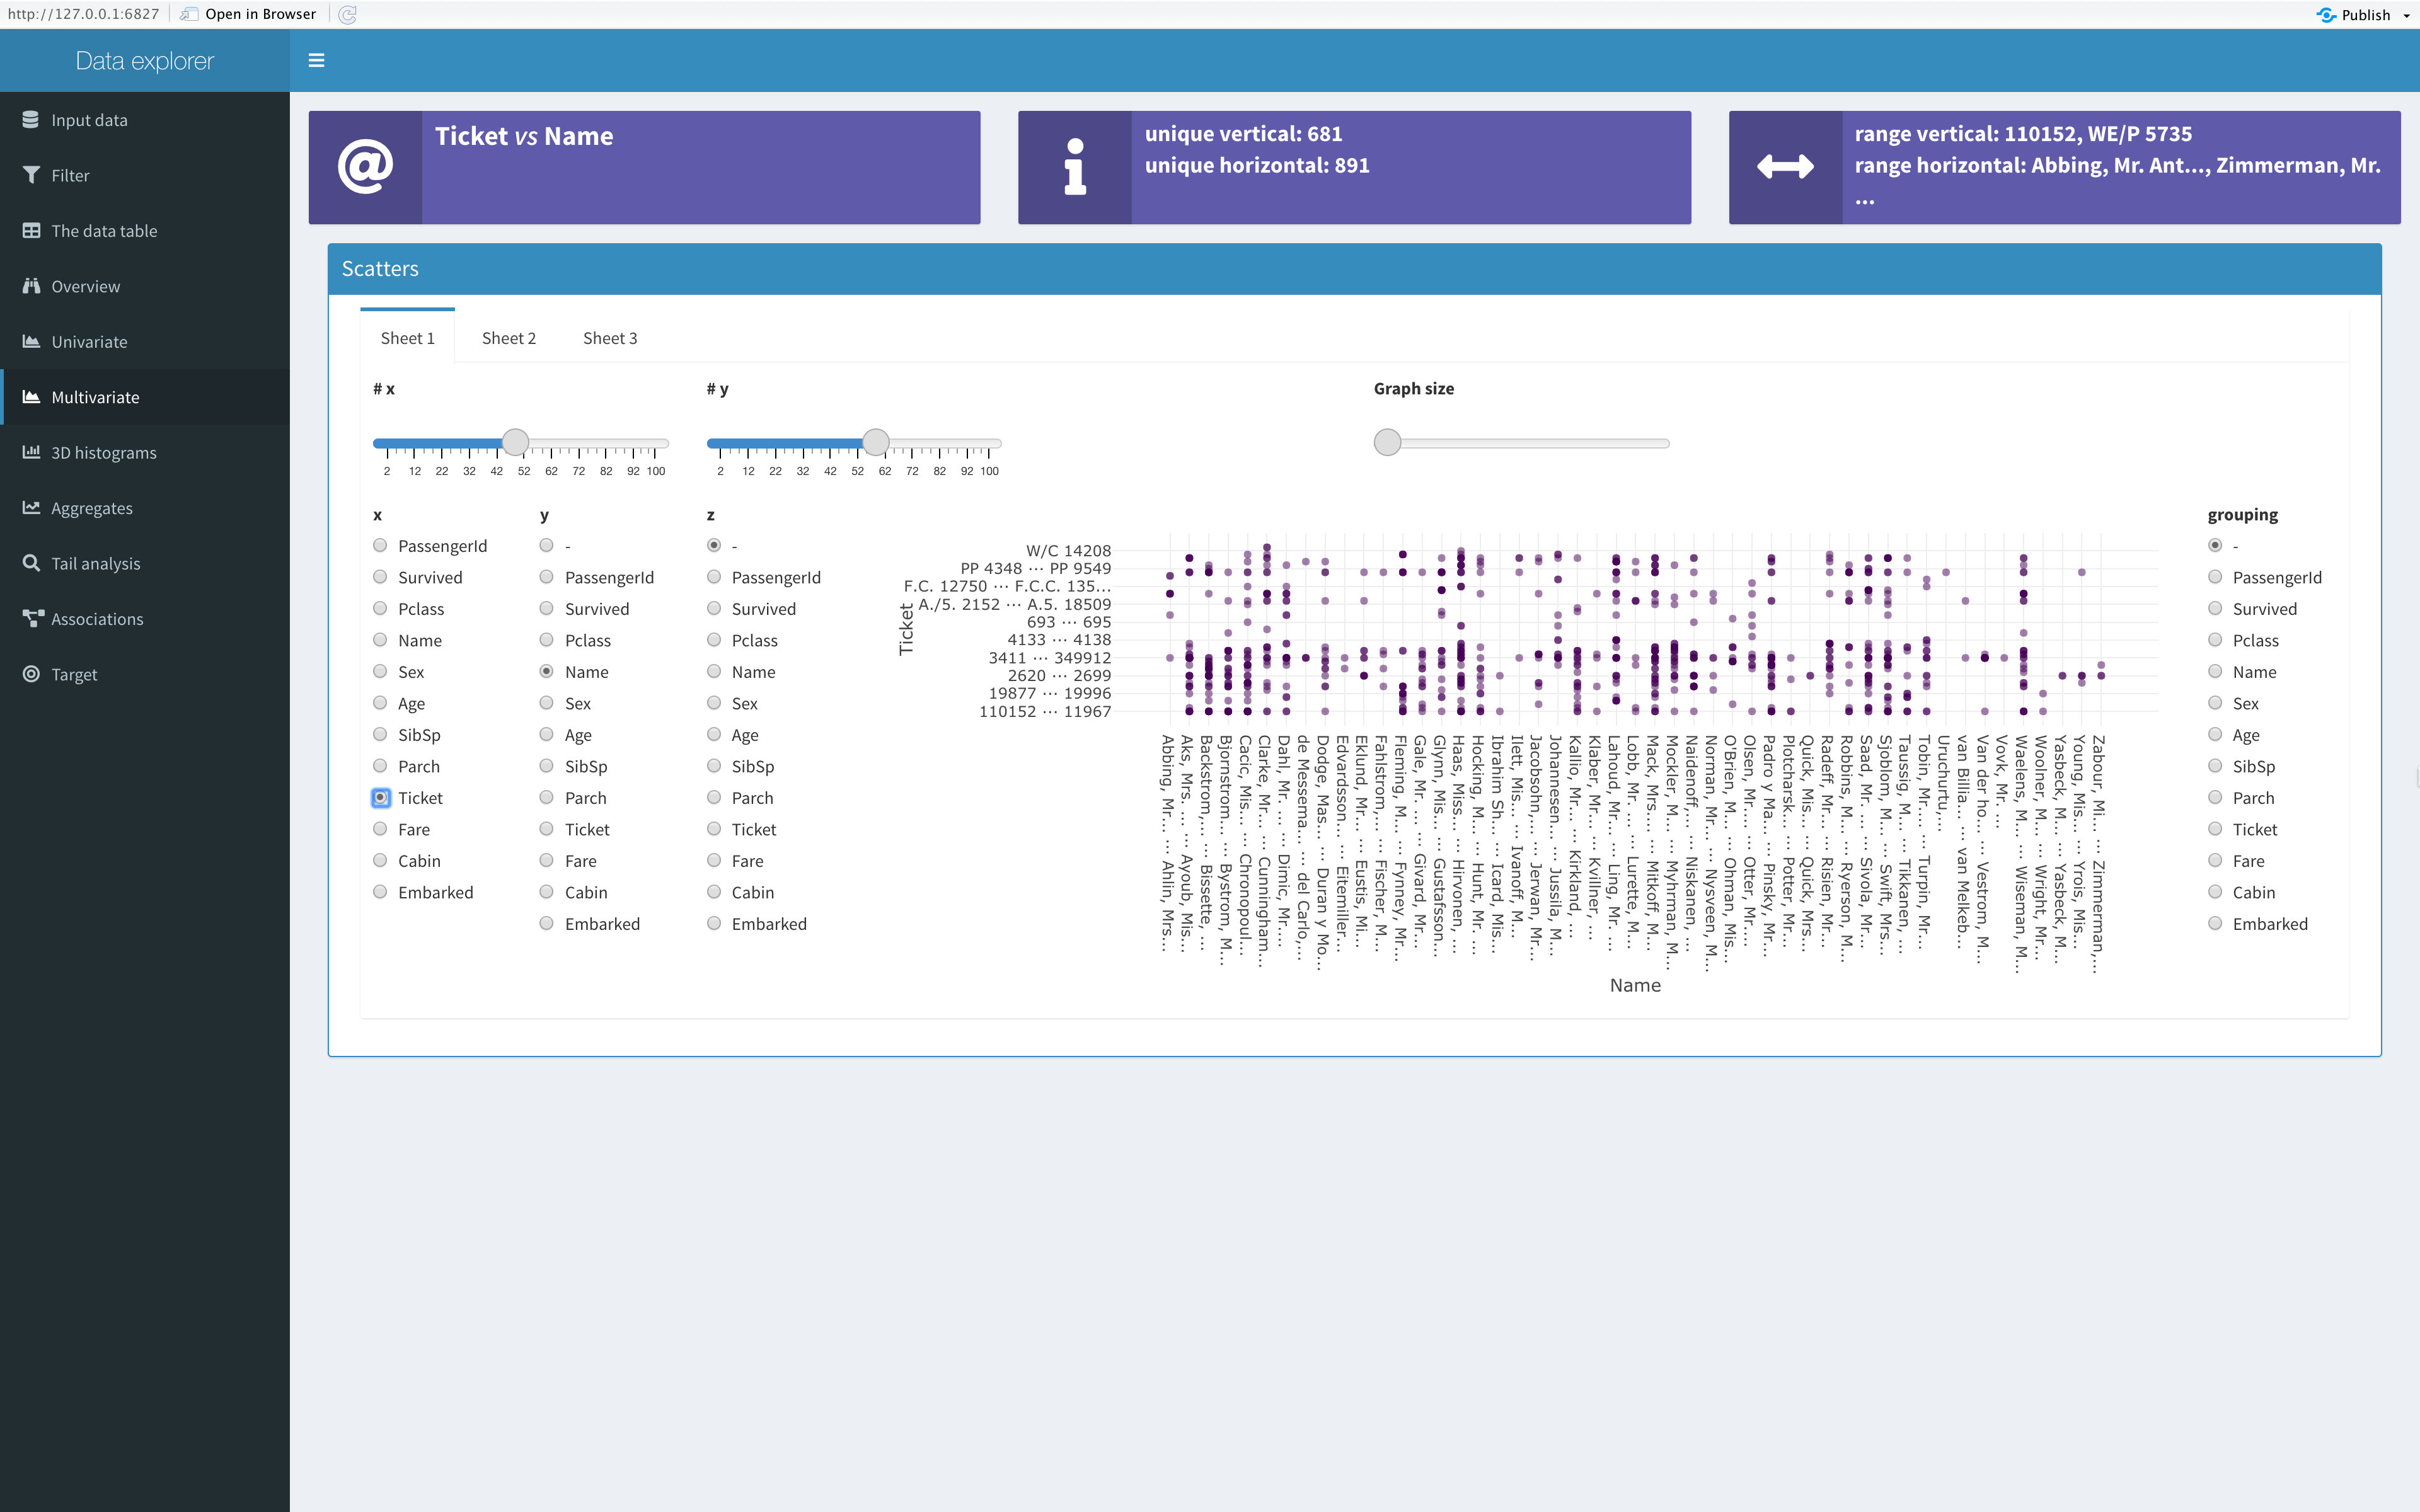
 Scatter plot of name of ticket (both granulations set by the sliders)
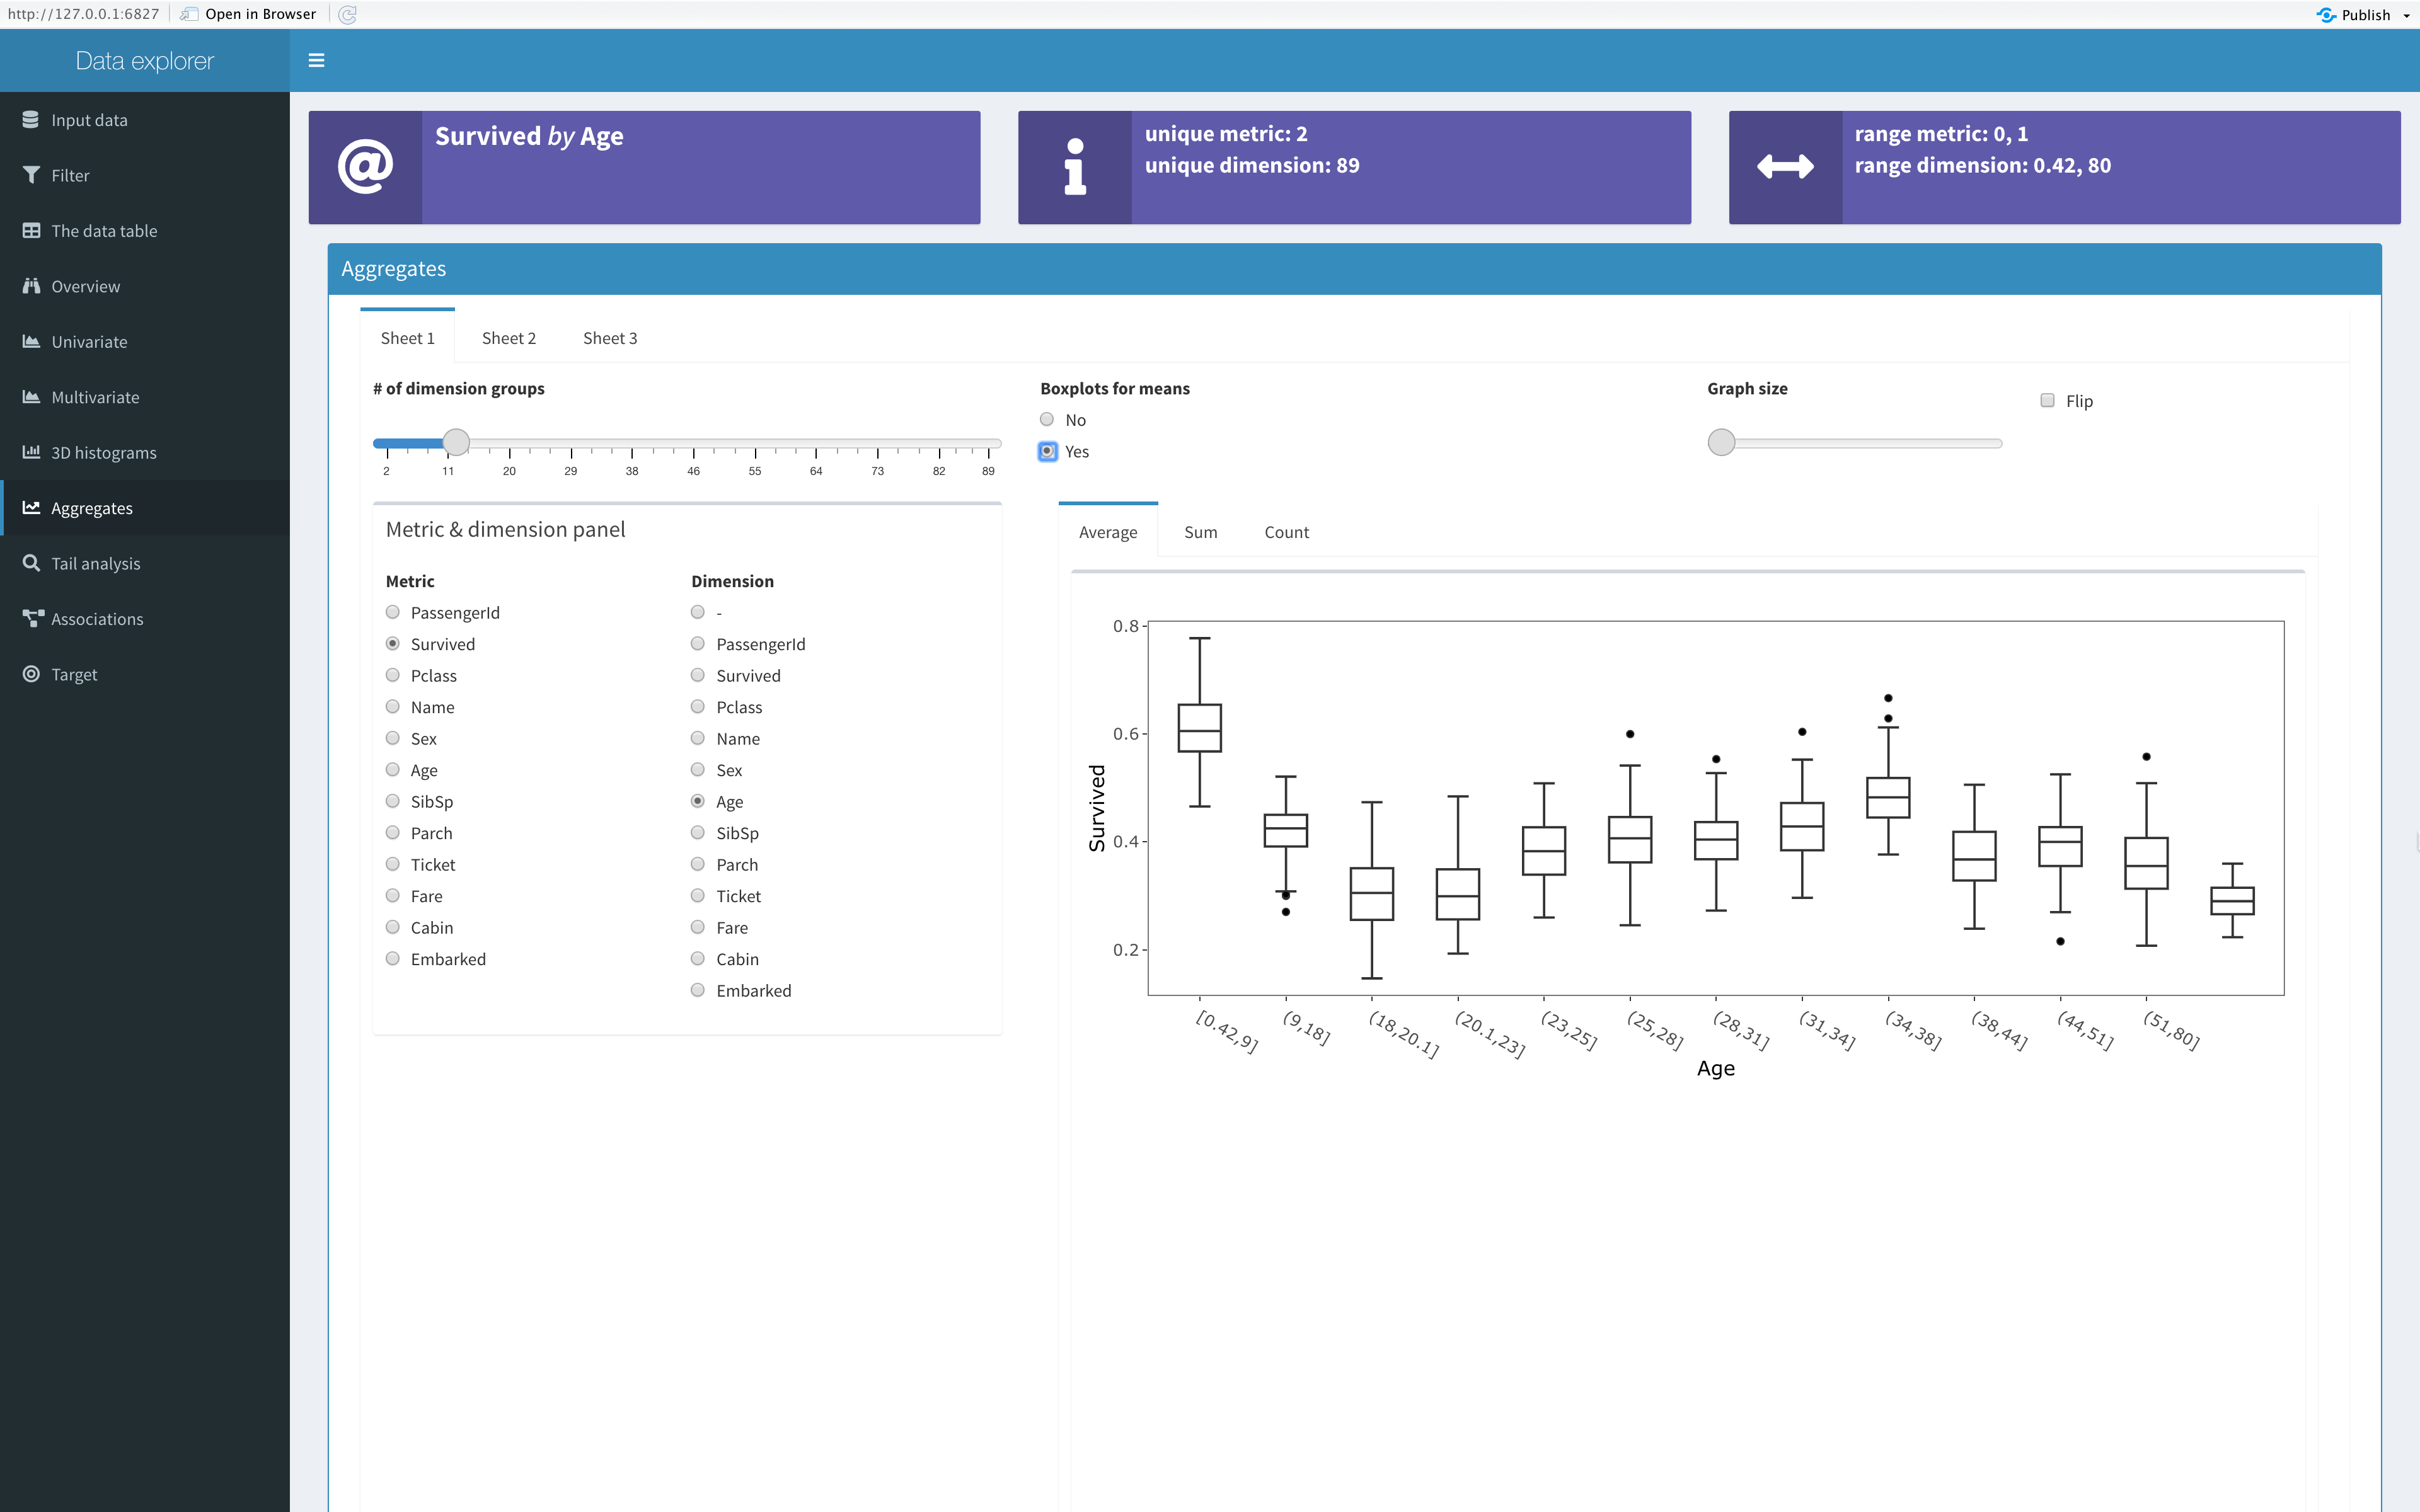
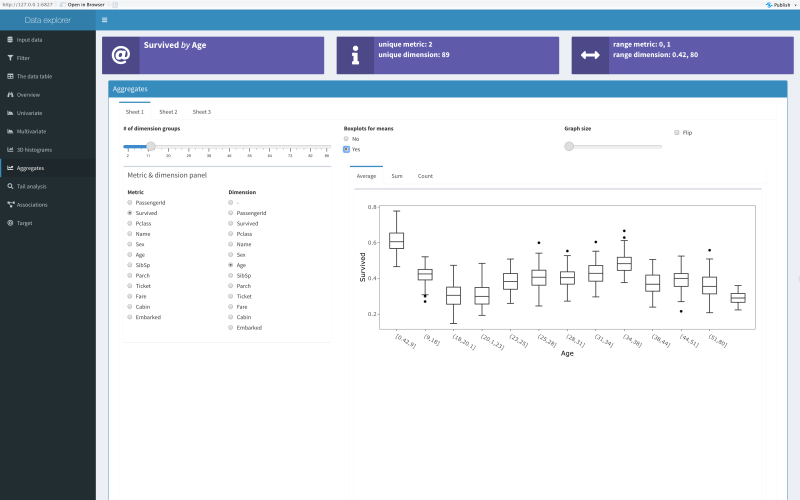 Survive rate for different age intervals (set by the slider)
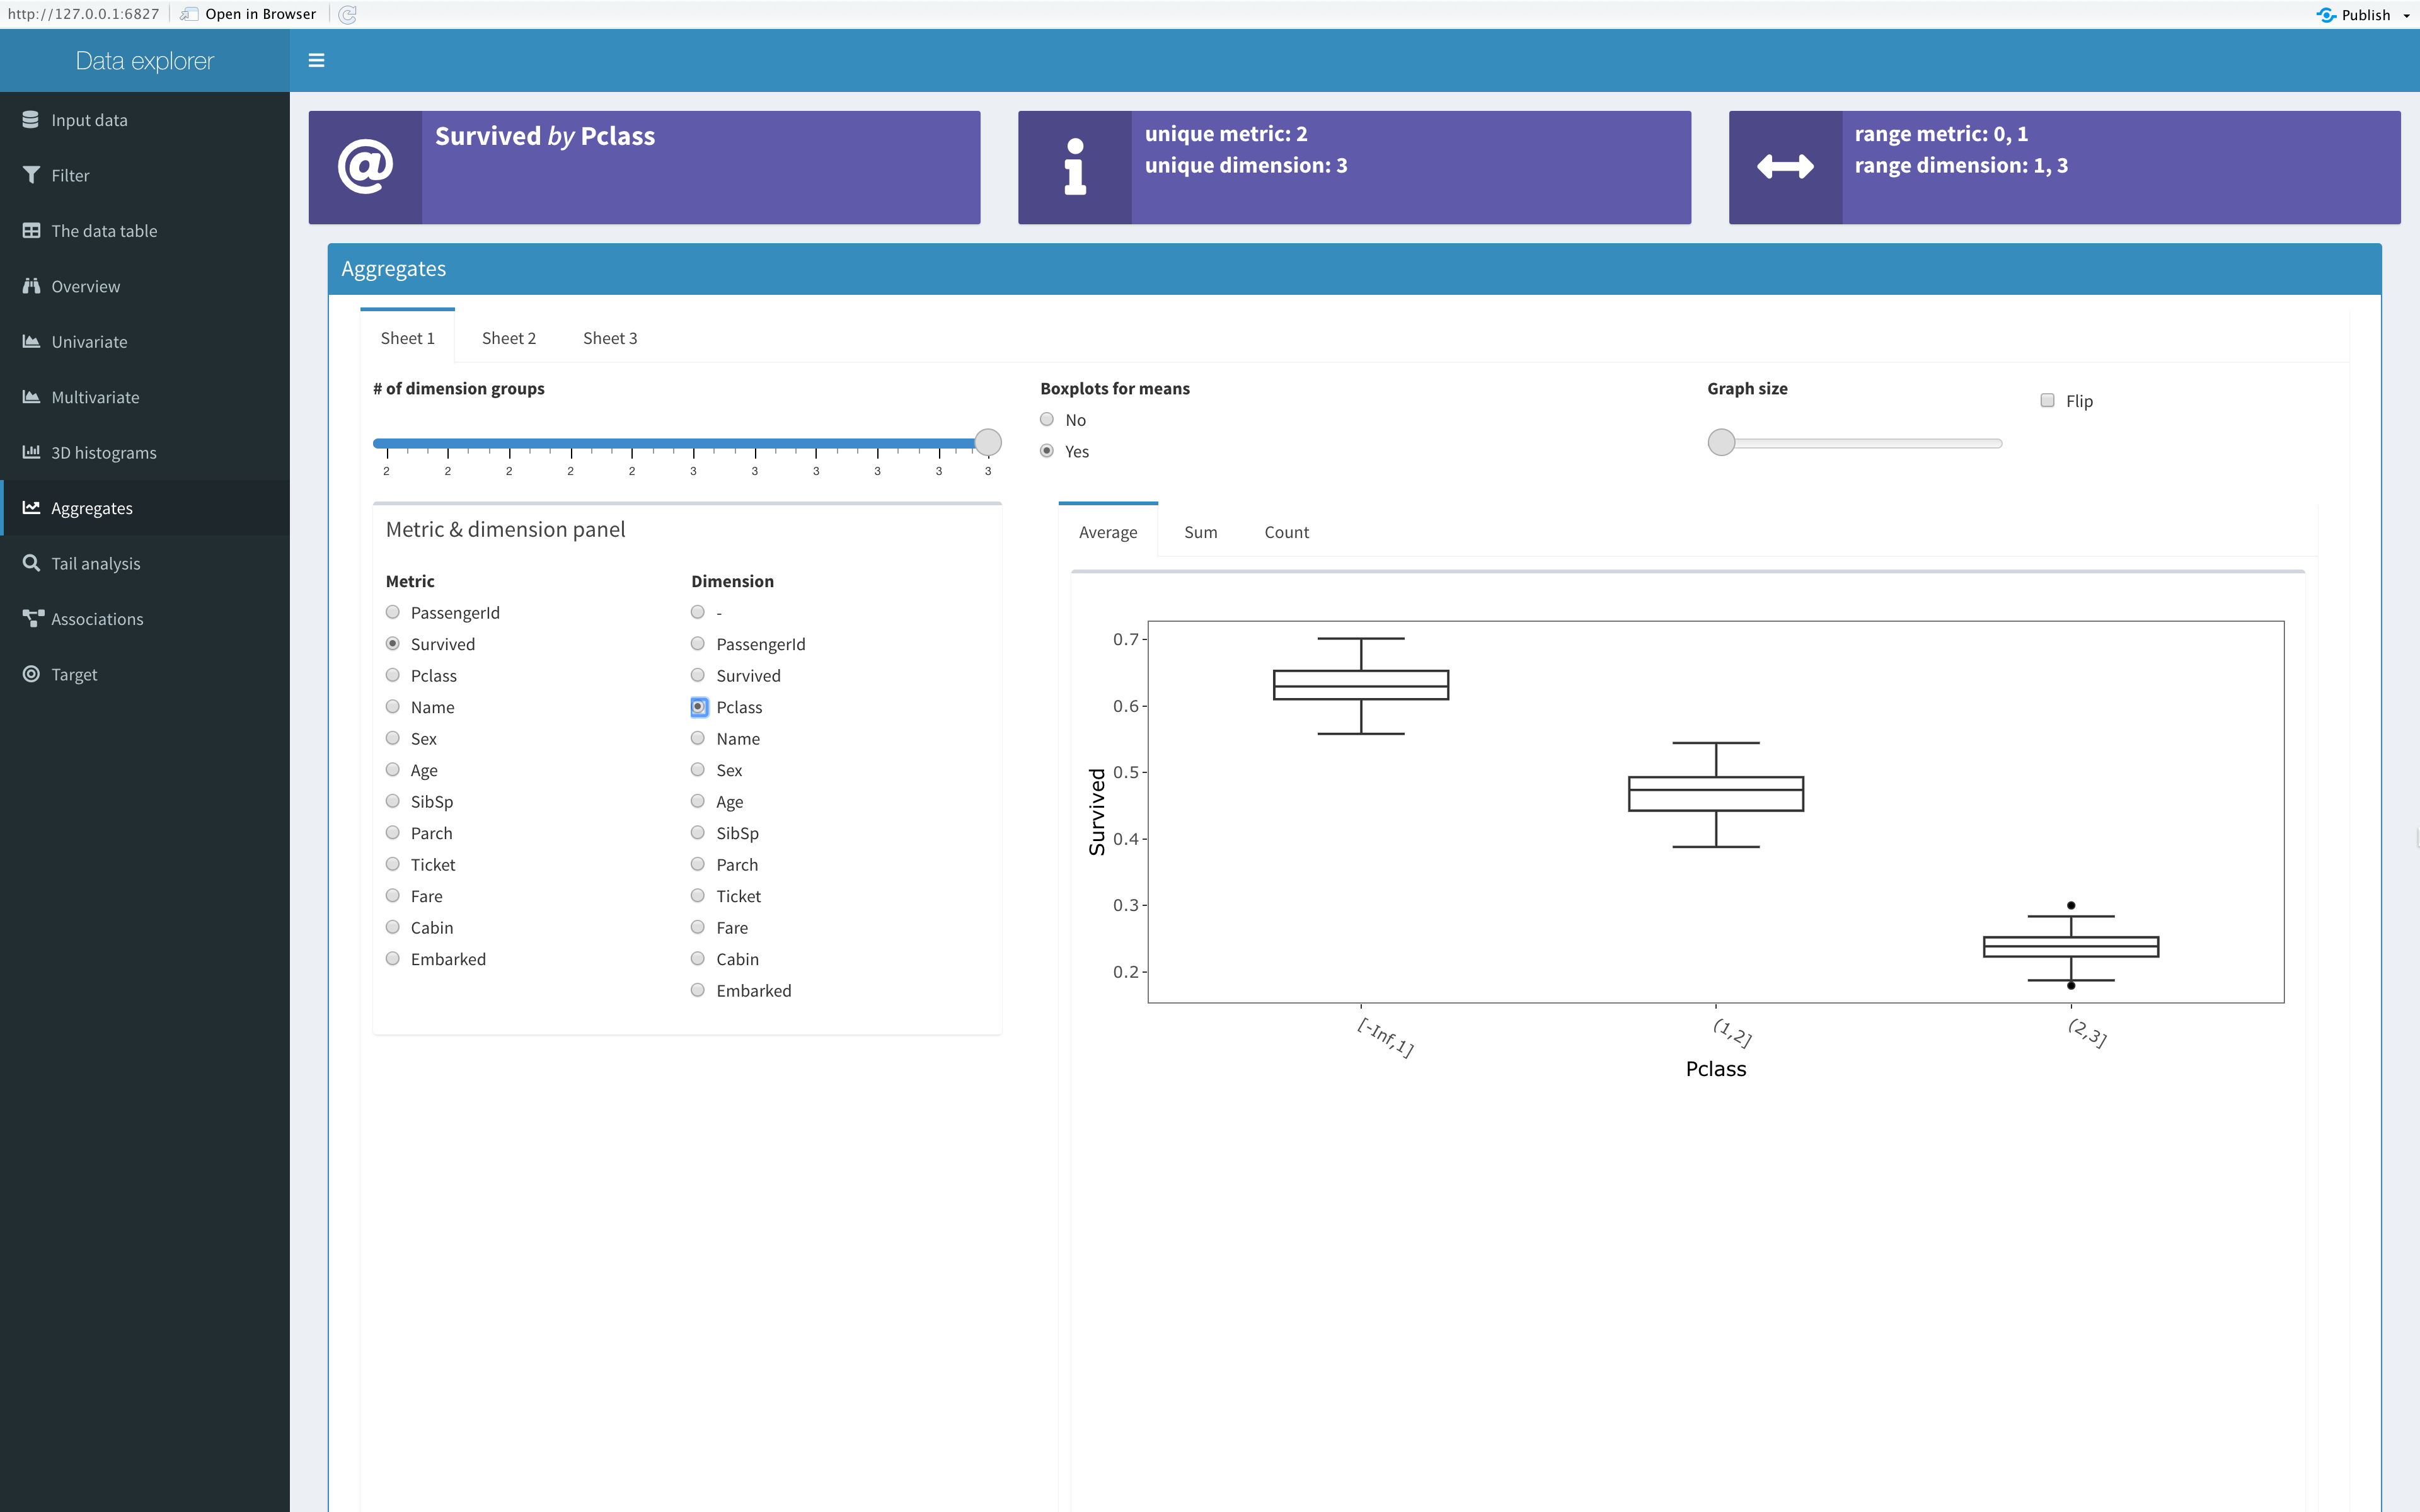
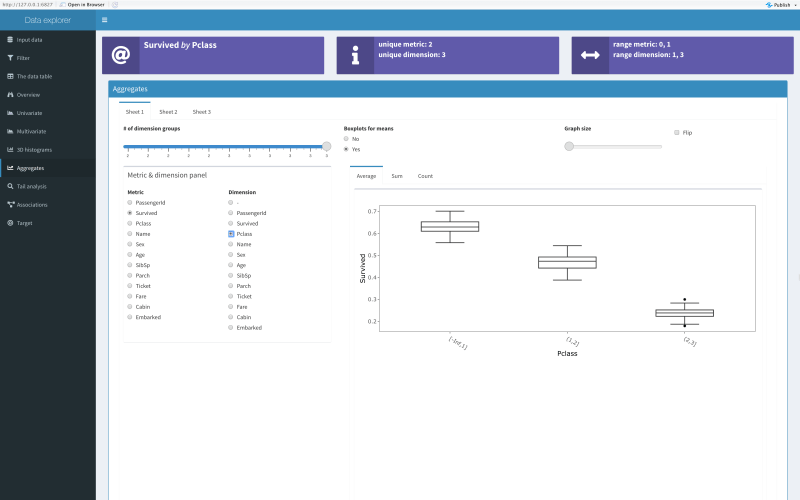 Survive rate for different passenger classes with boxplots.
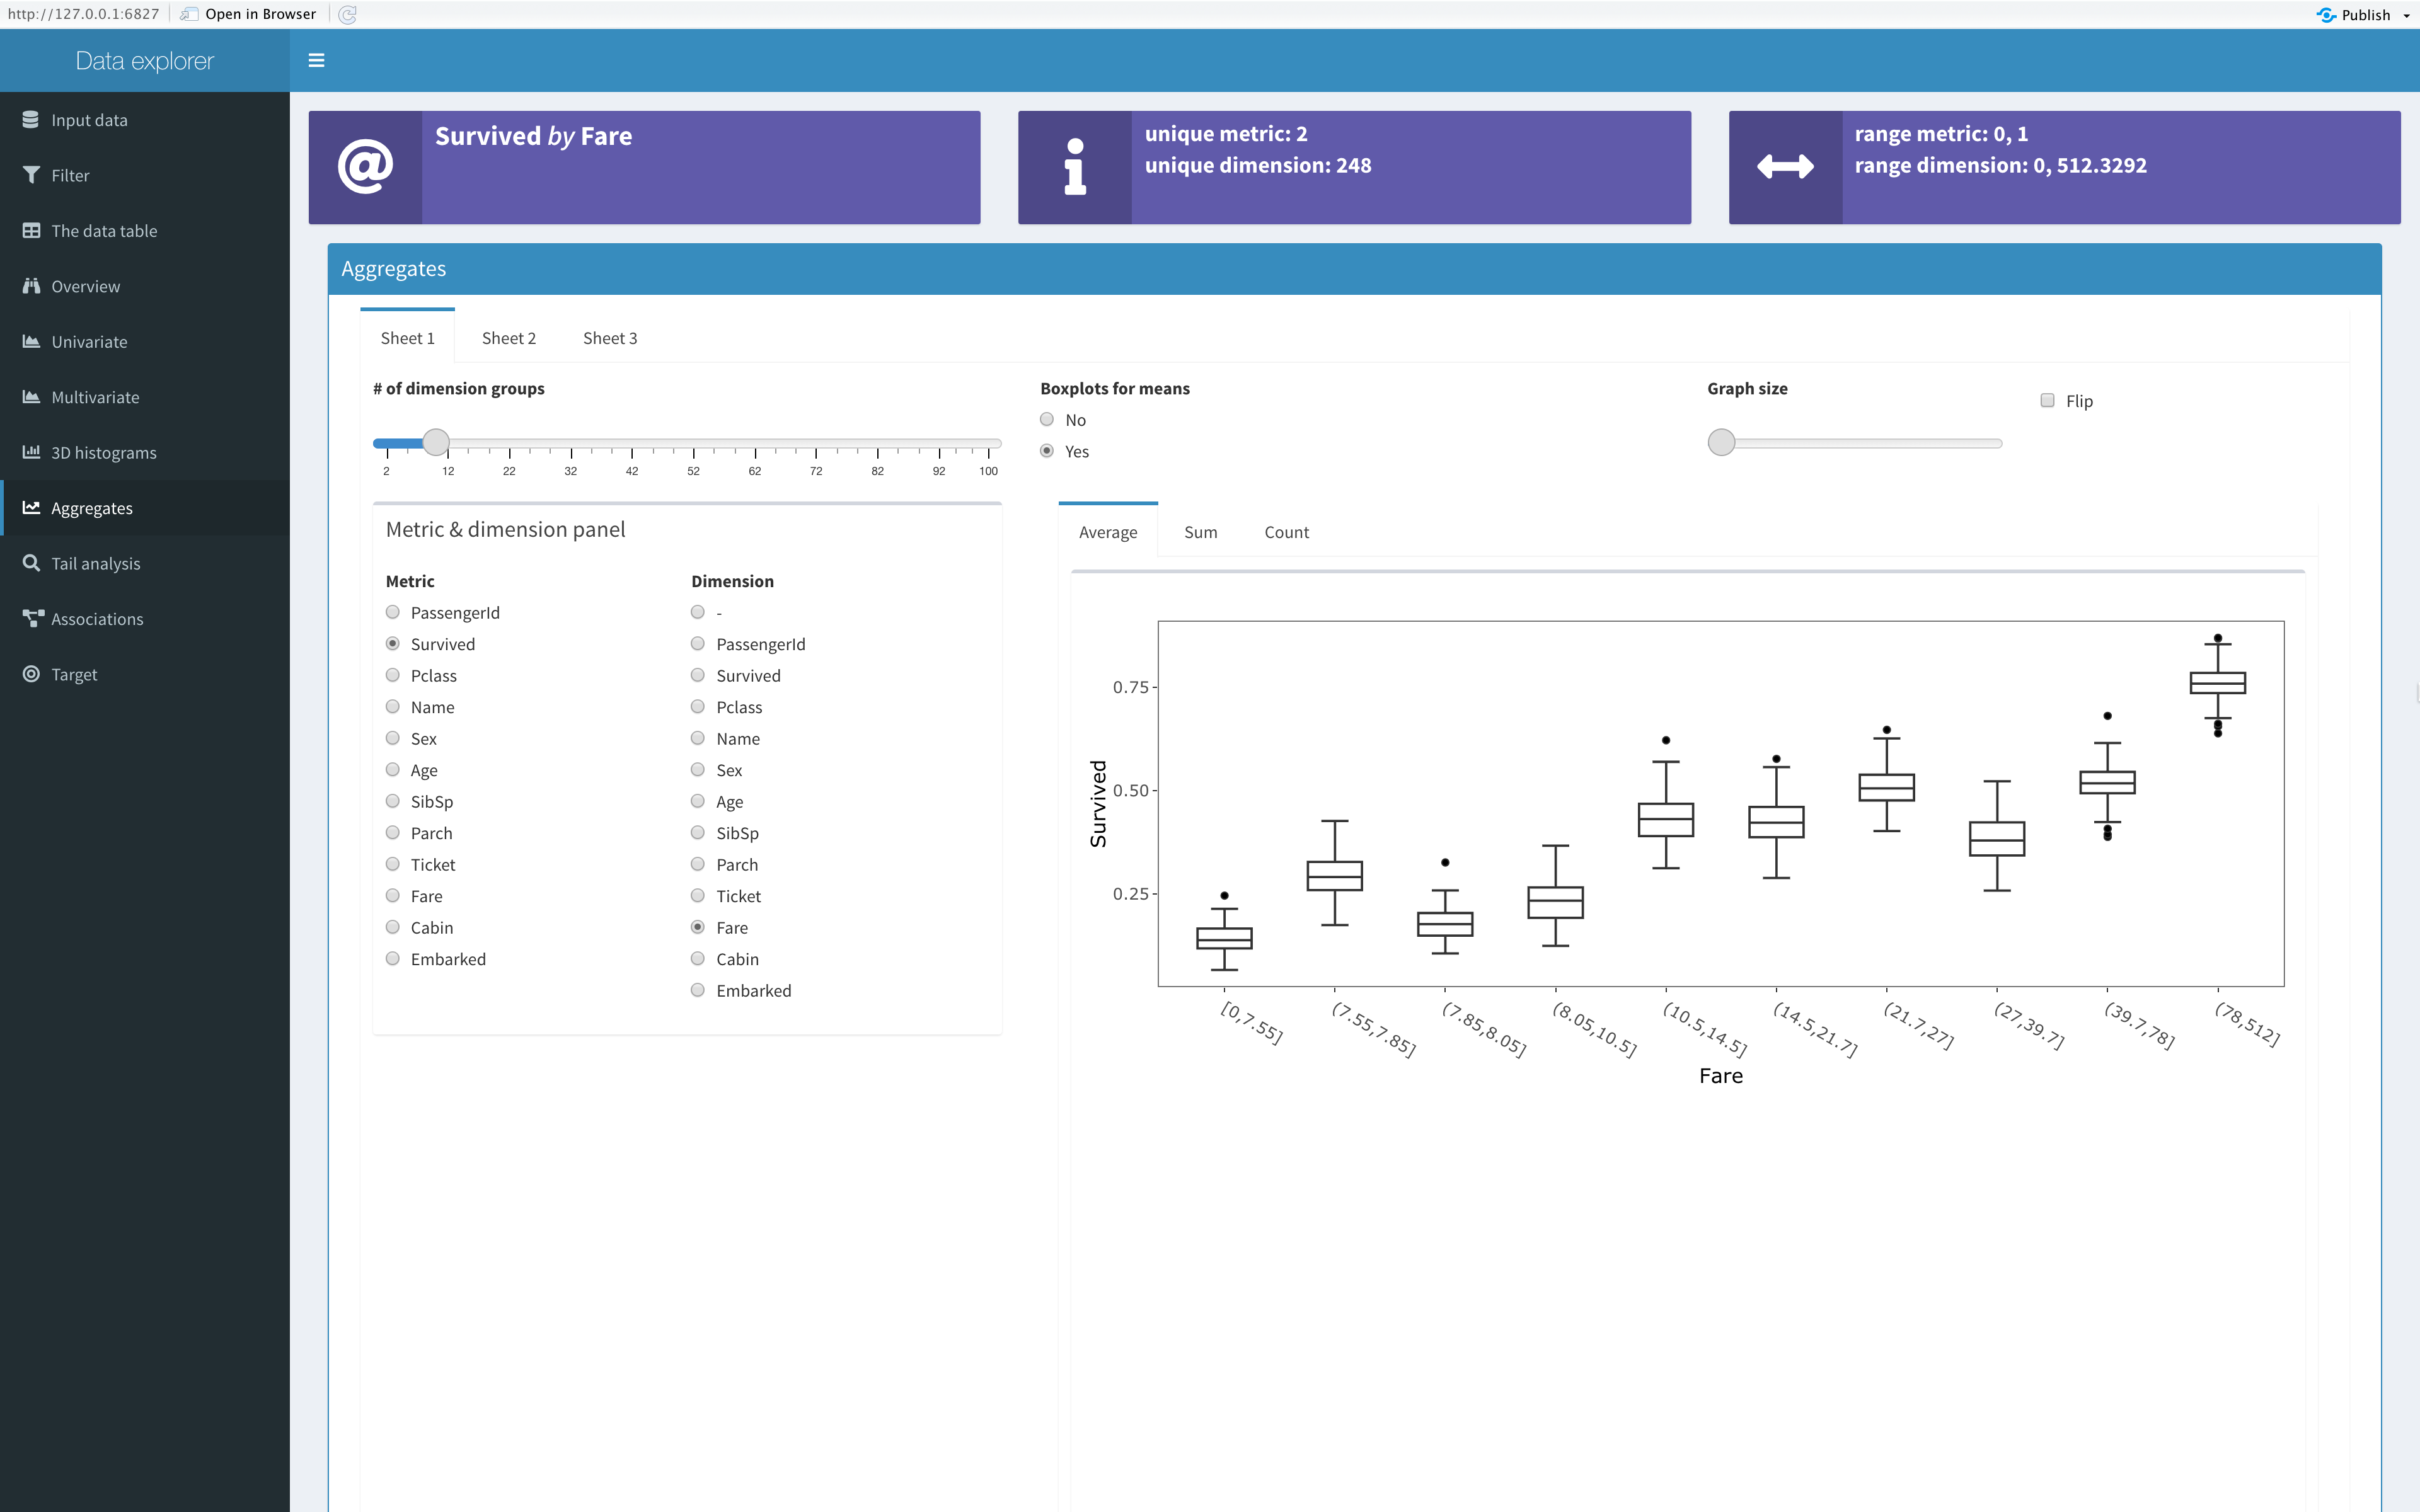
 Survive rate for different fare intervals (set by the slider) with boxplots.
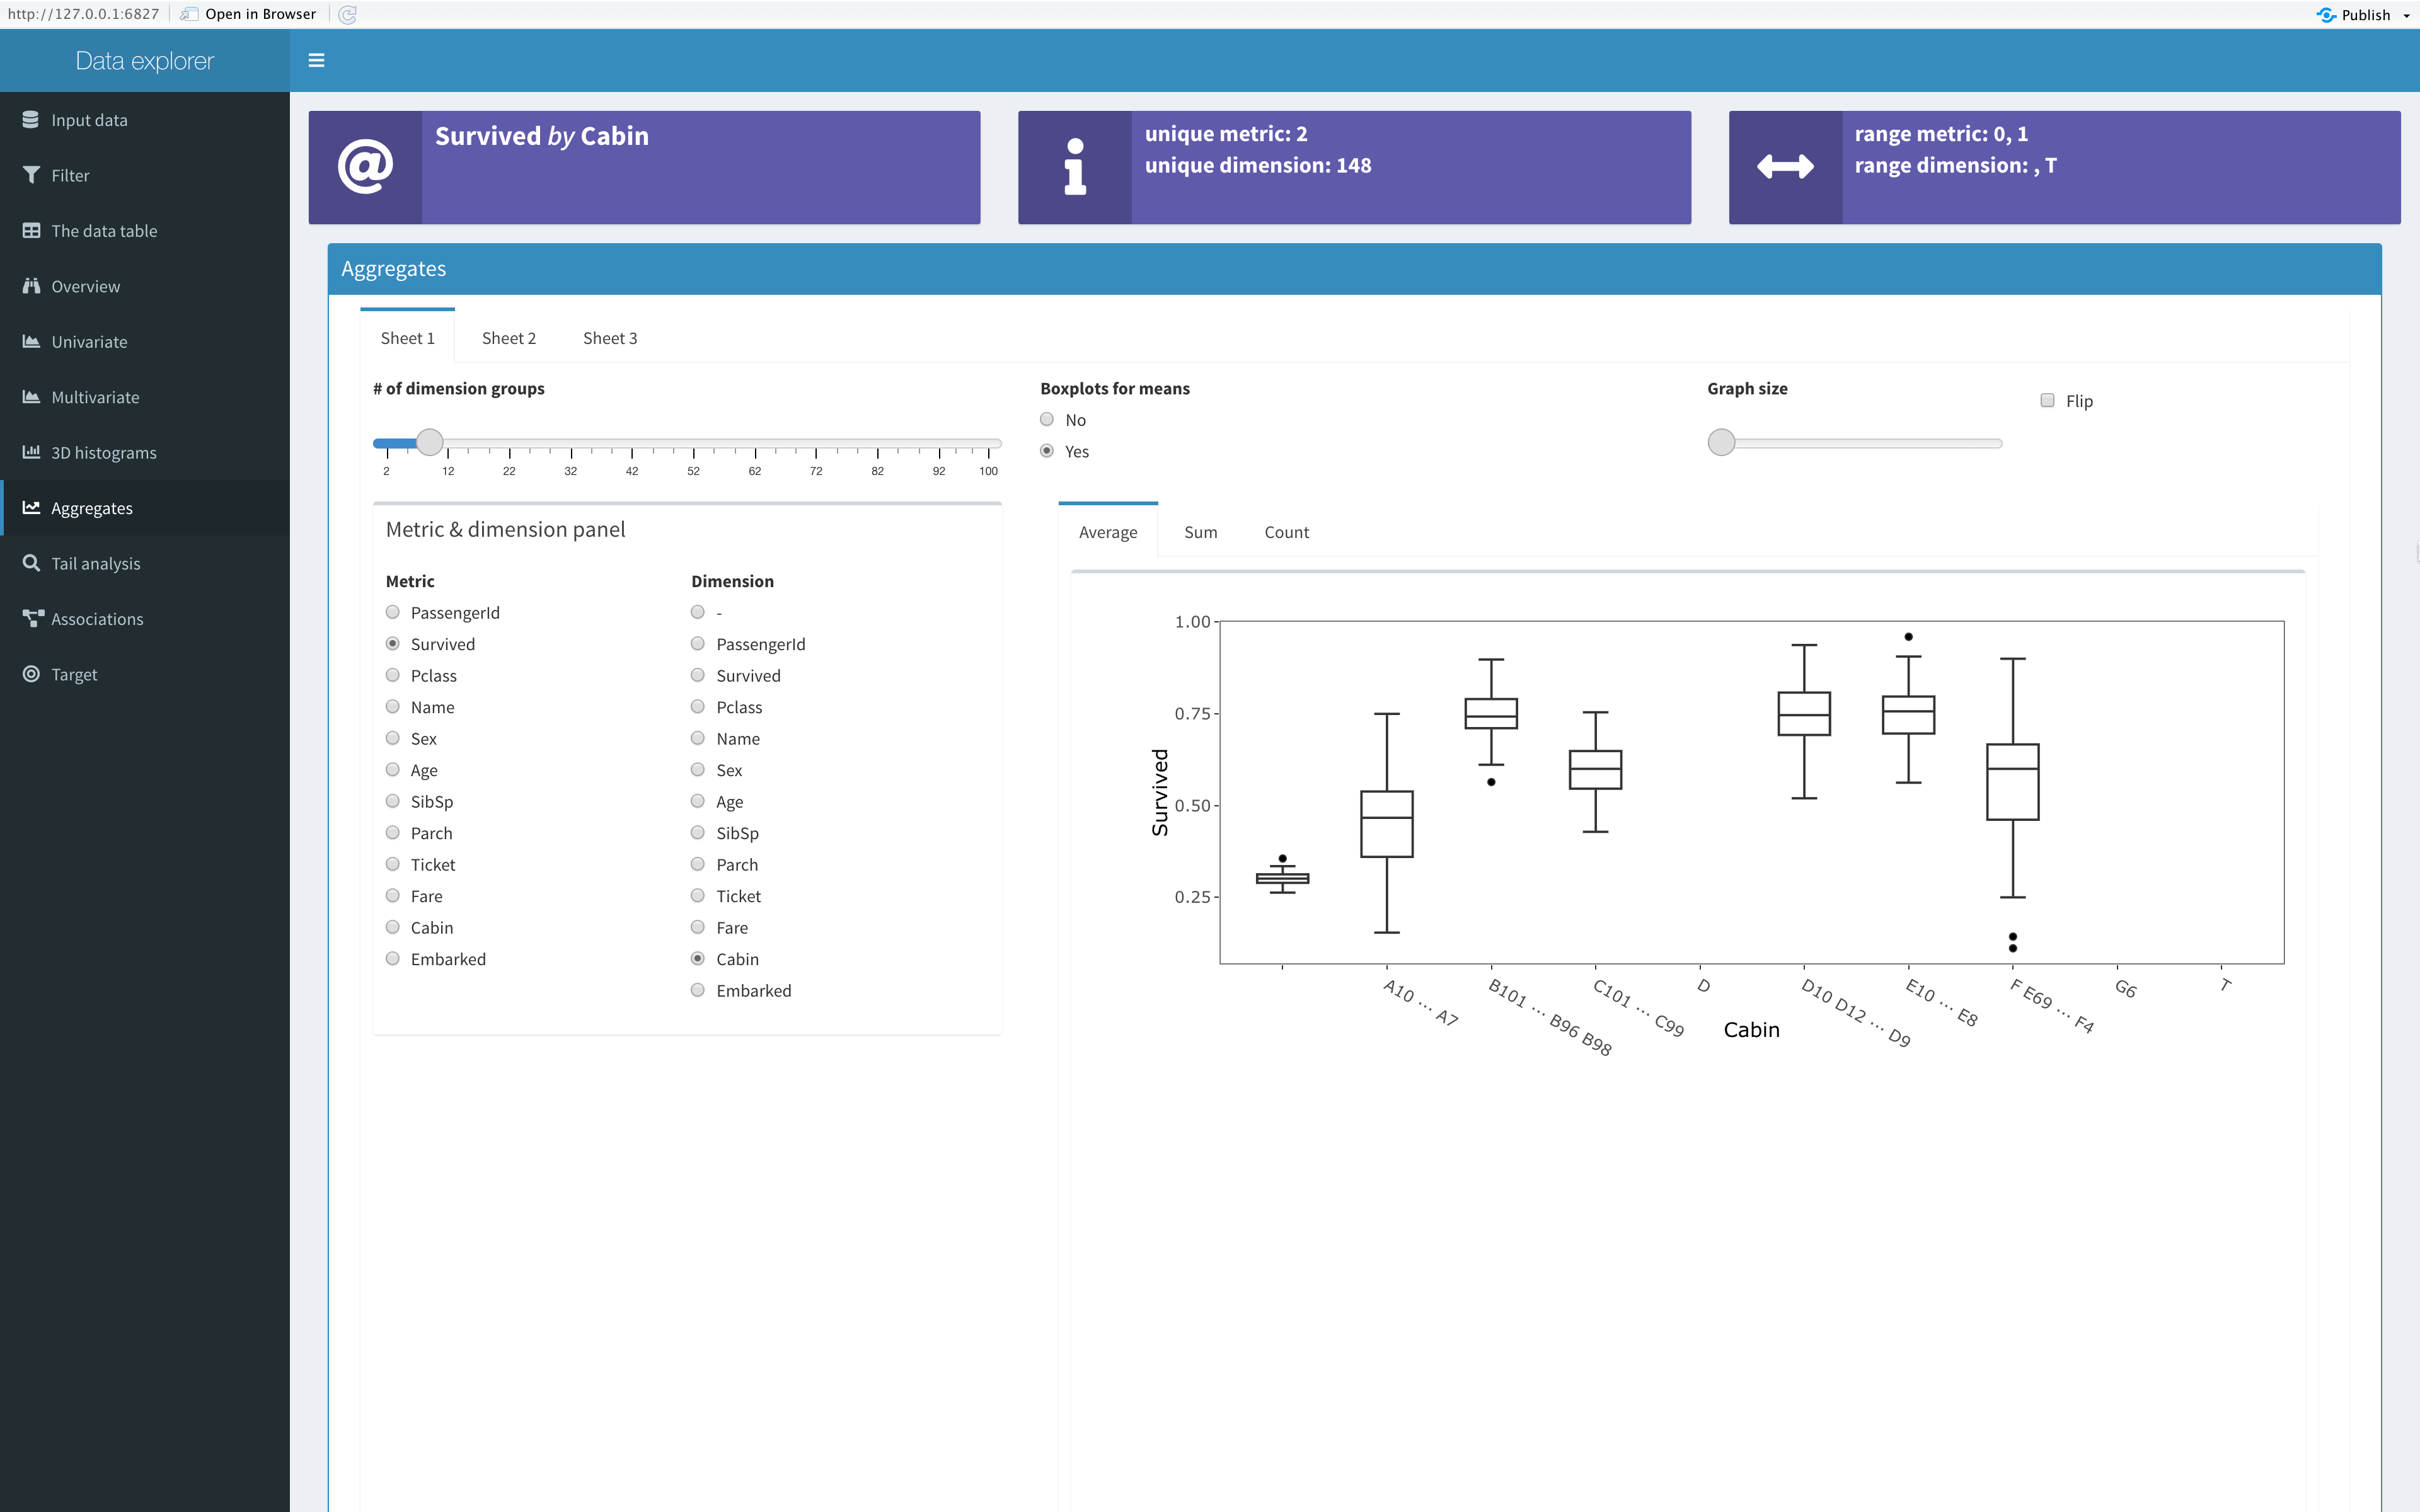
 Survive rate for different cabin numbers (set by the slider) with boxplots.
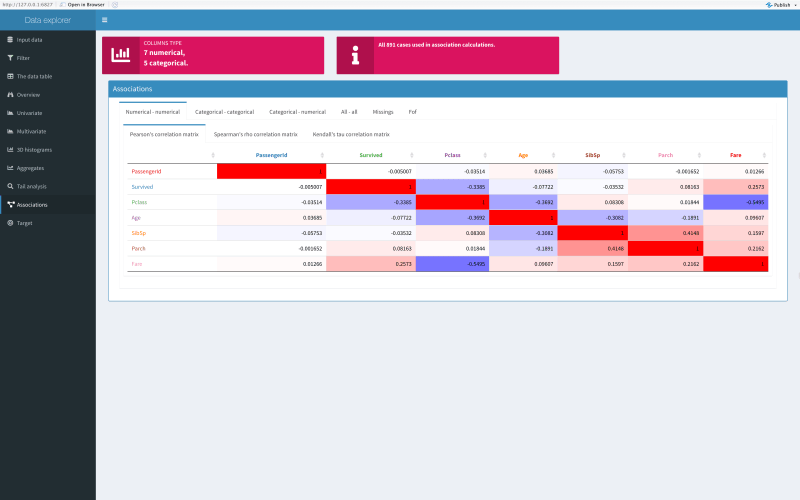 Correlations among numerical variables.
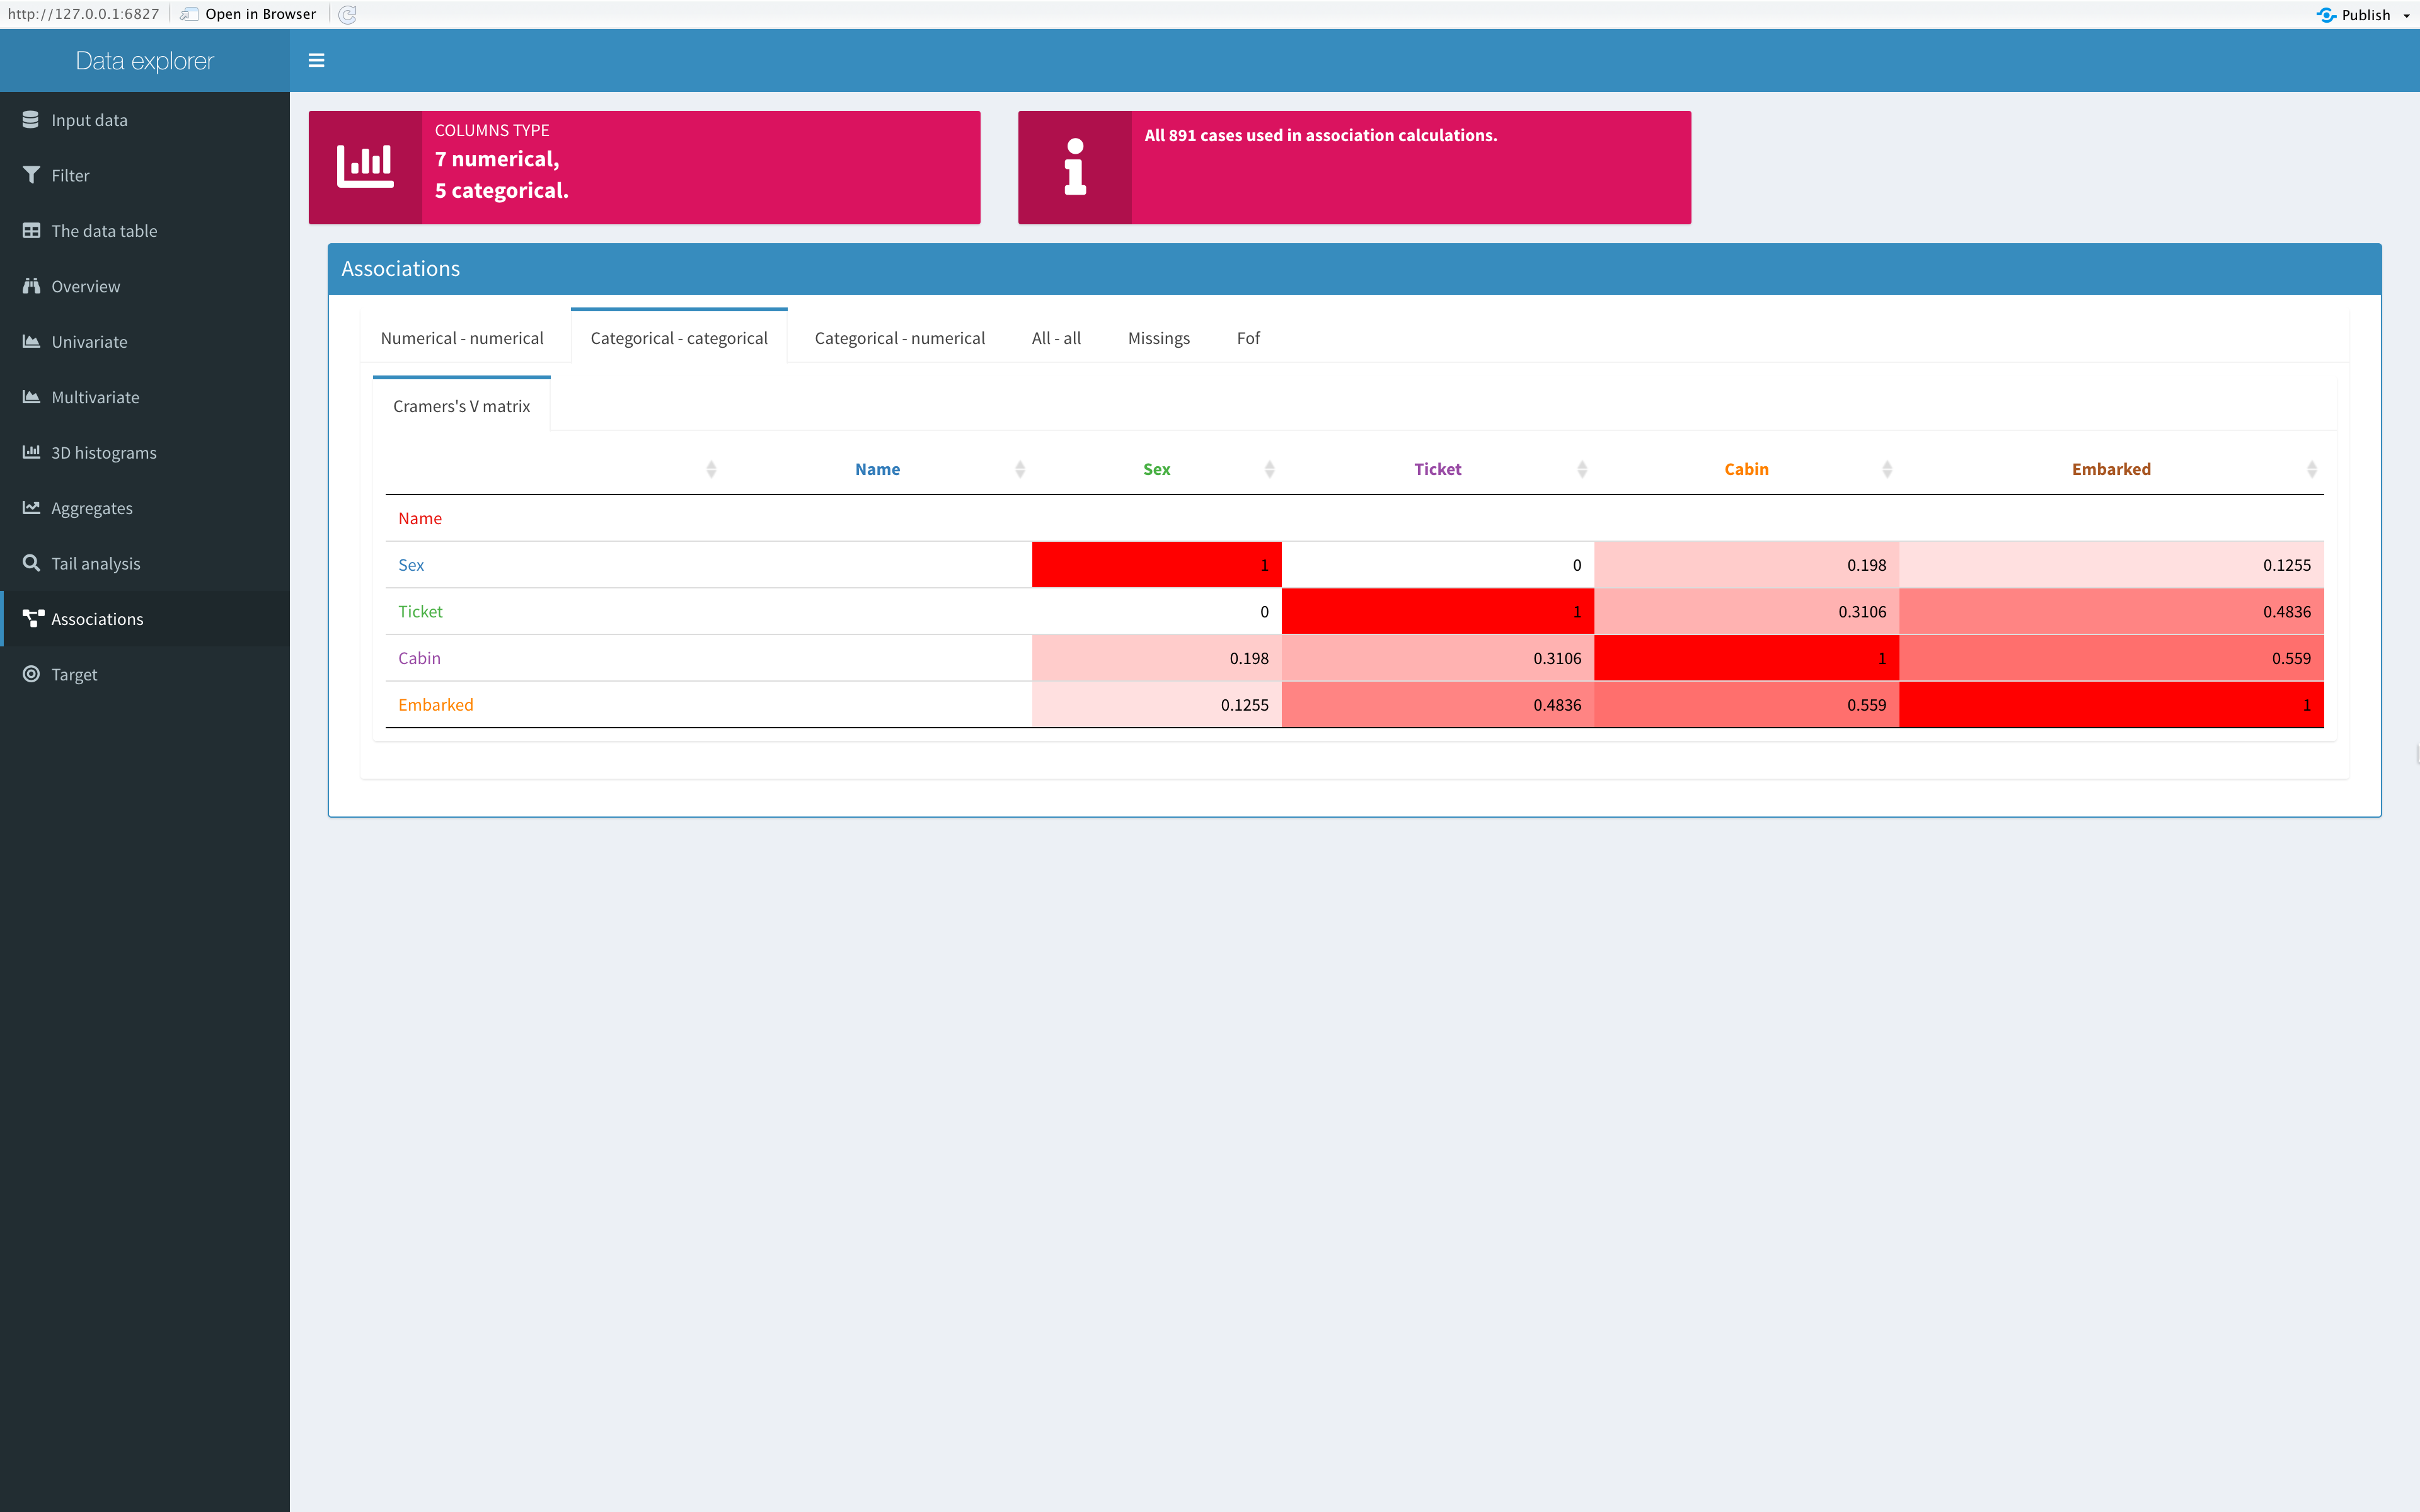
 Correlations among categorical variables.
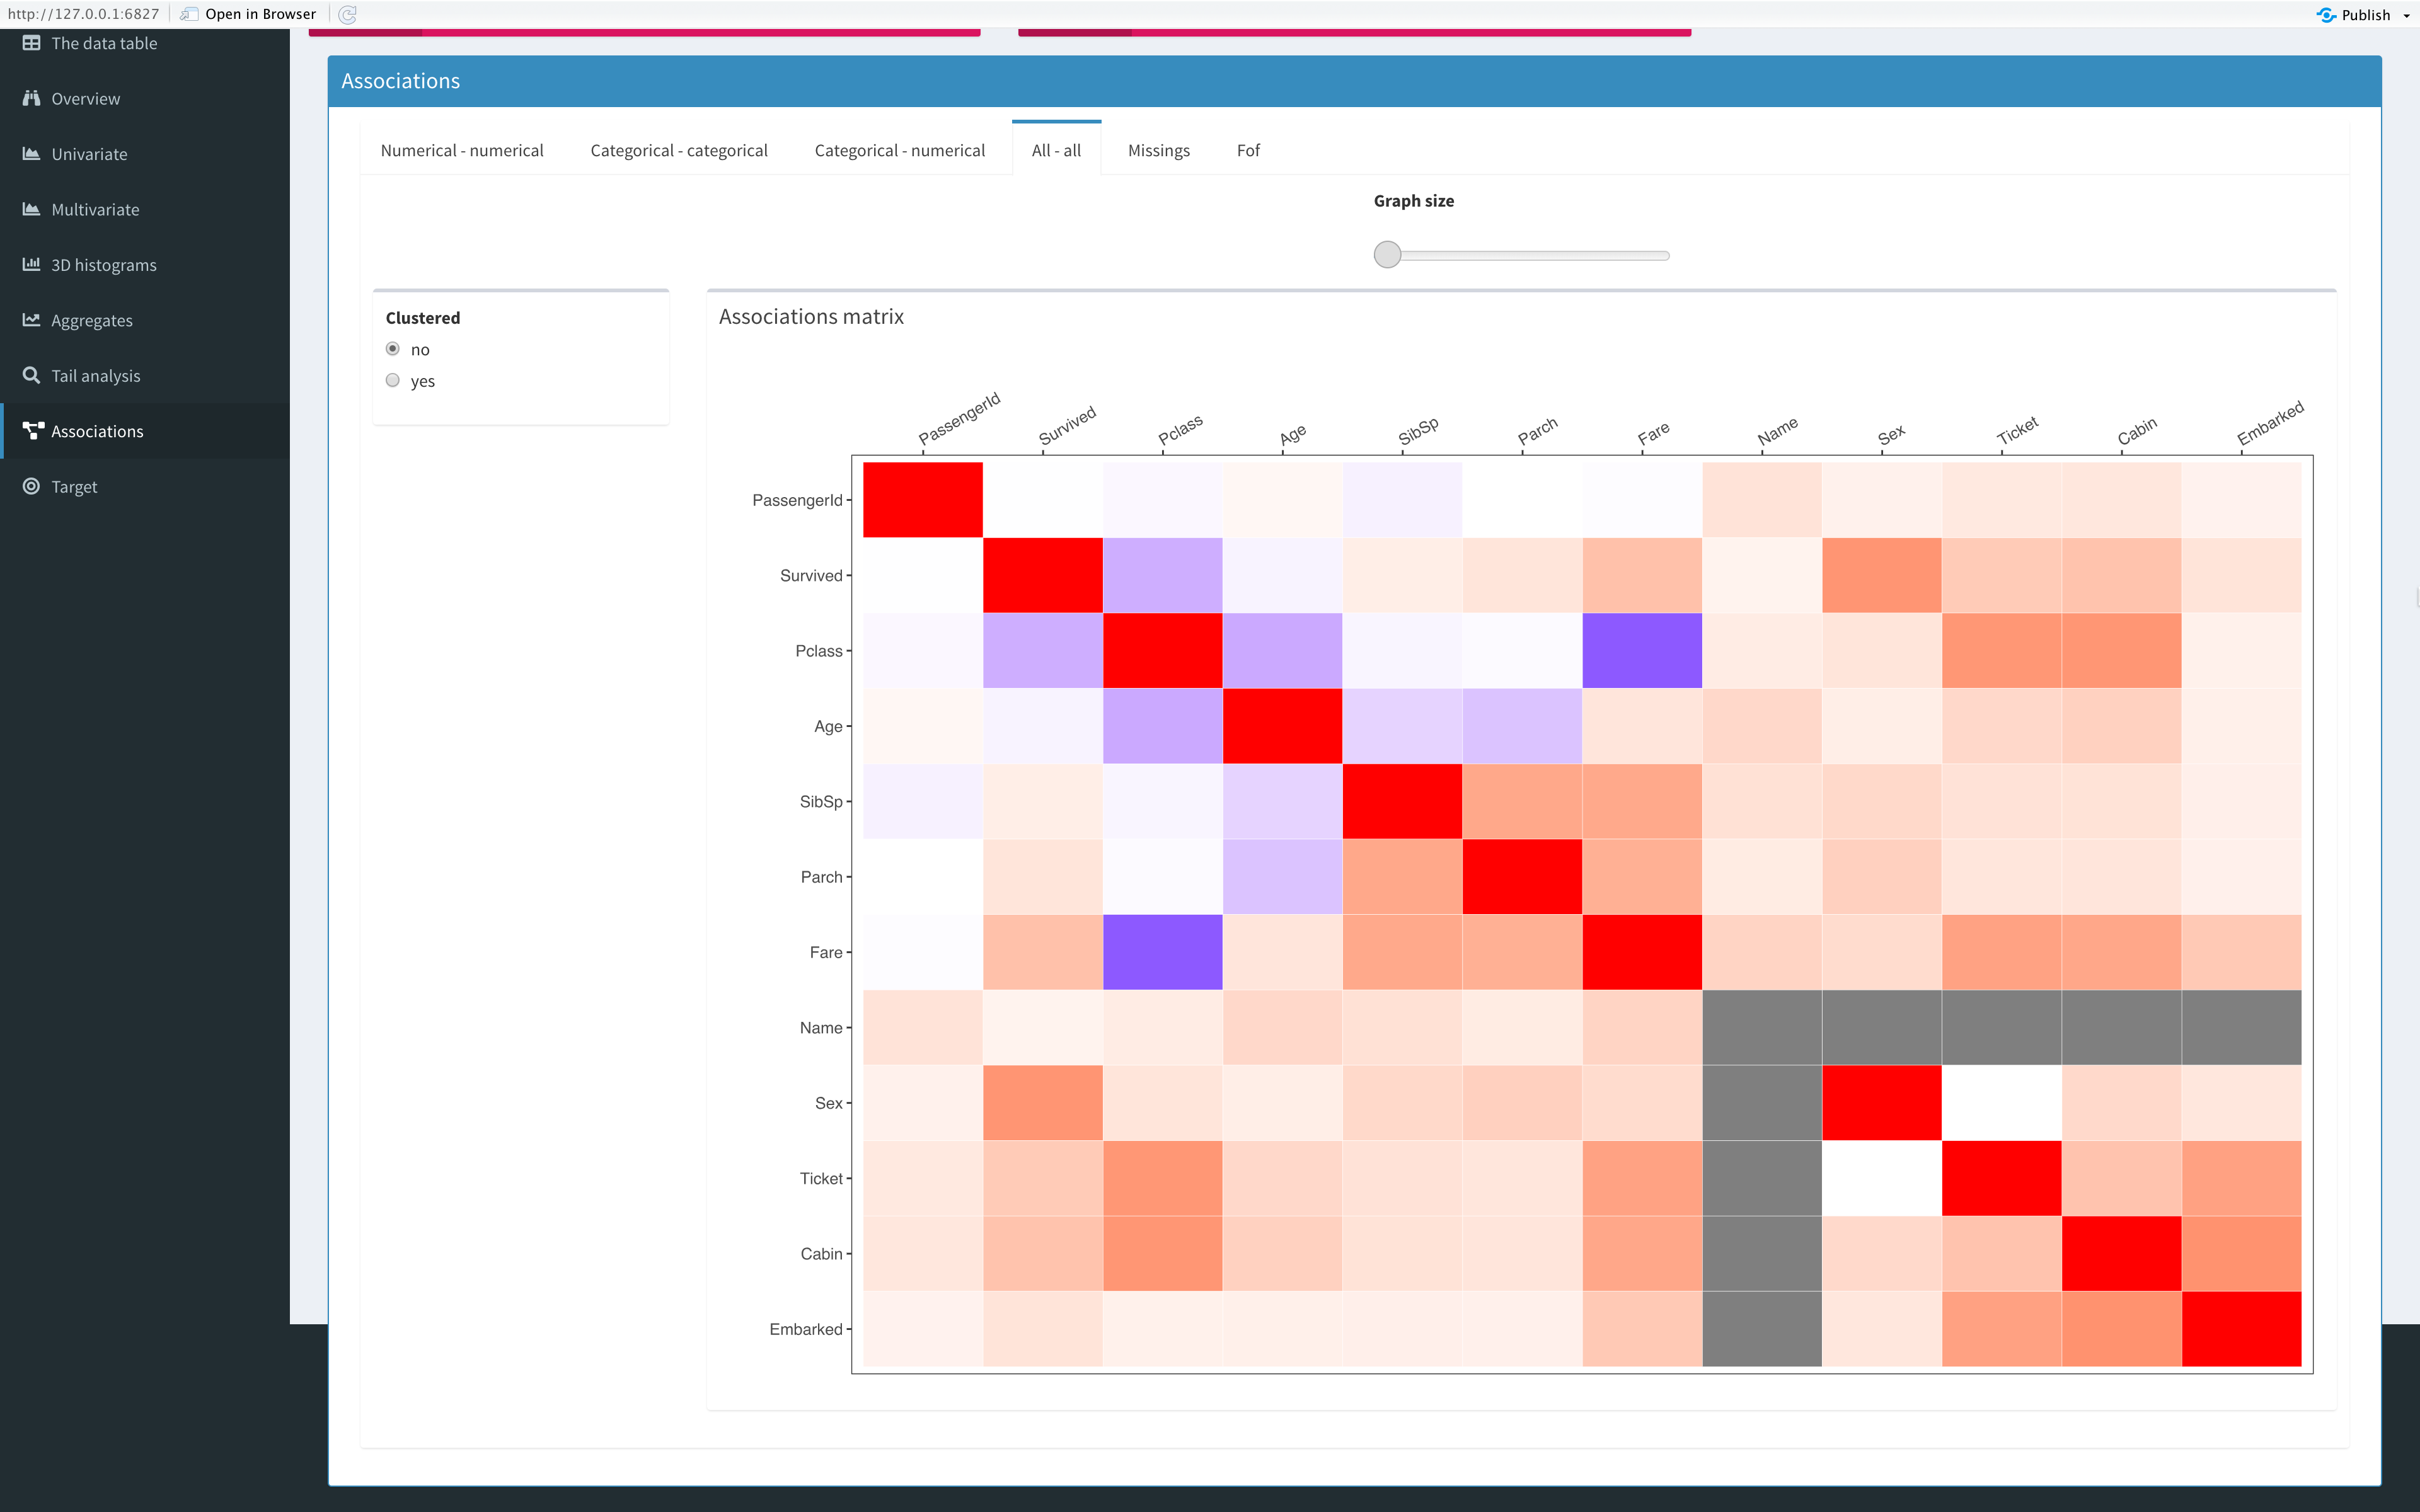
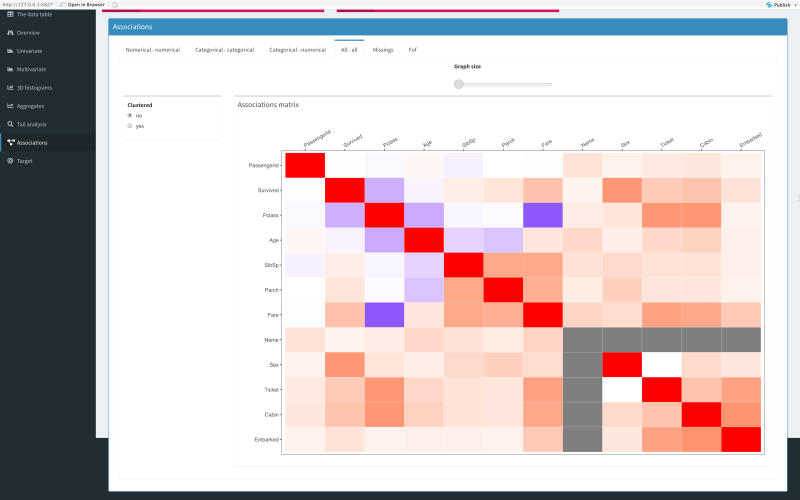 Correlations among all variables.