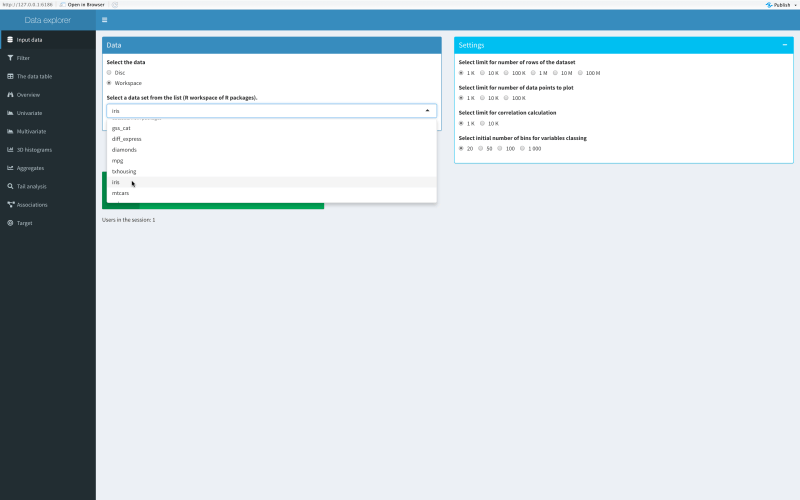
 Select the data set.
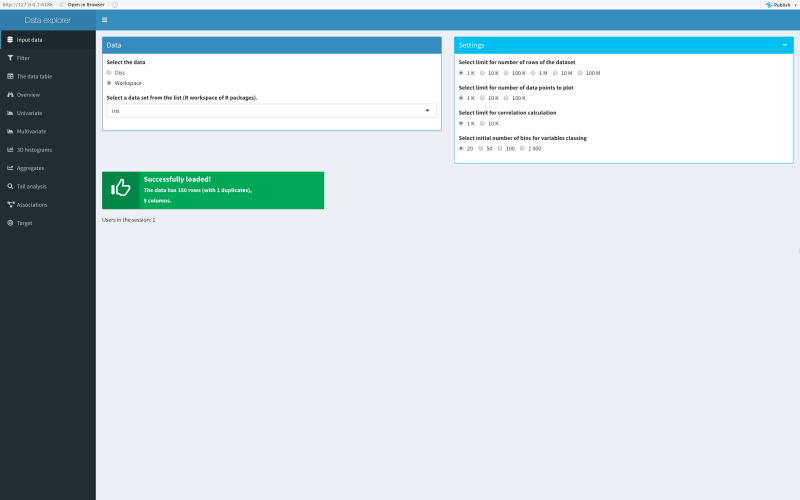 When data is loaded, short info about number of rows and columns is showed.
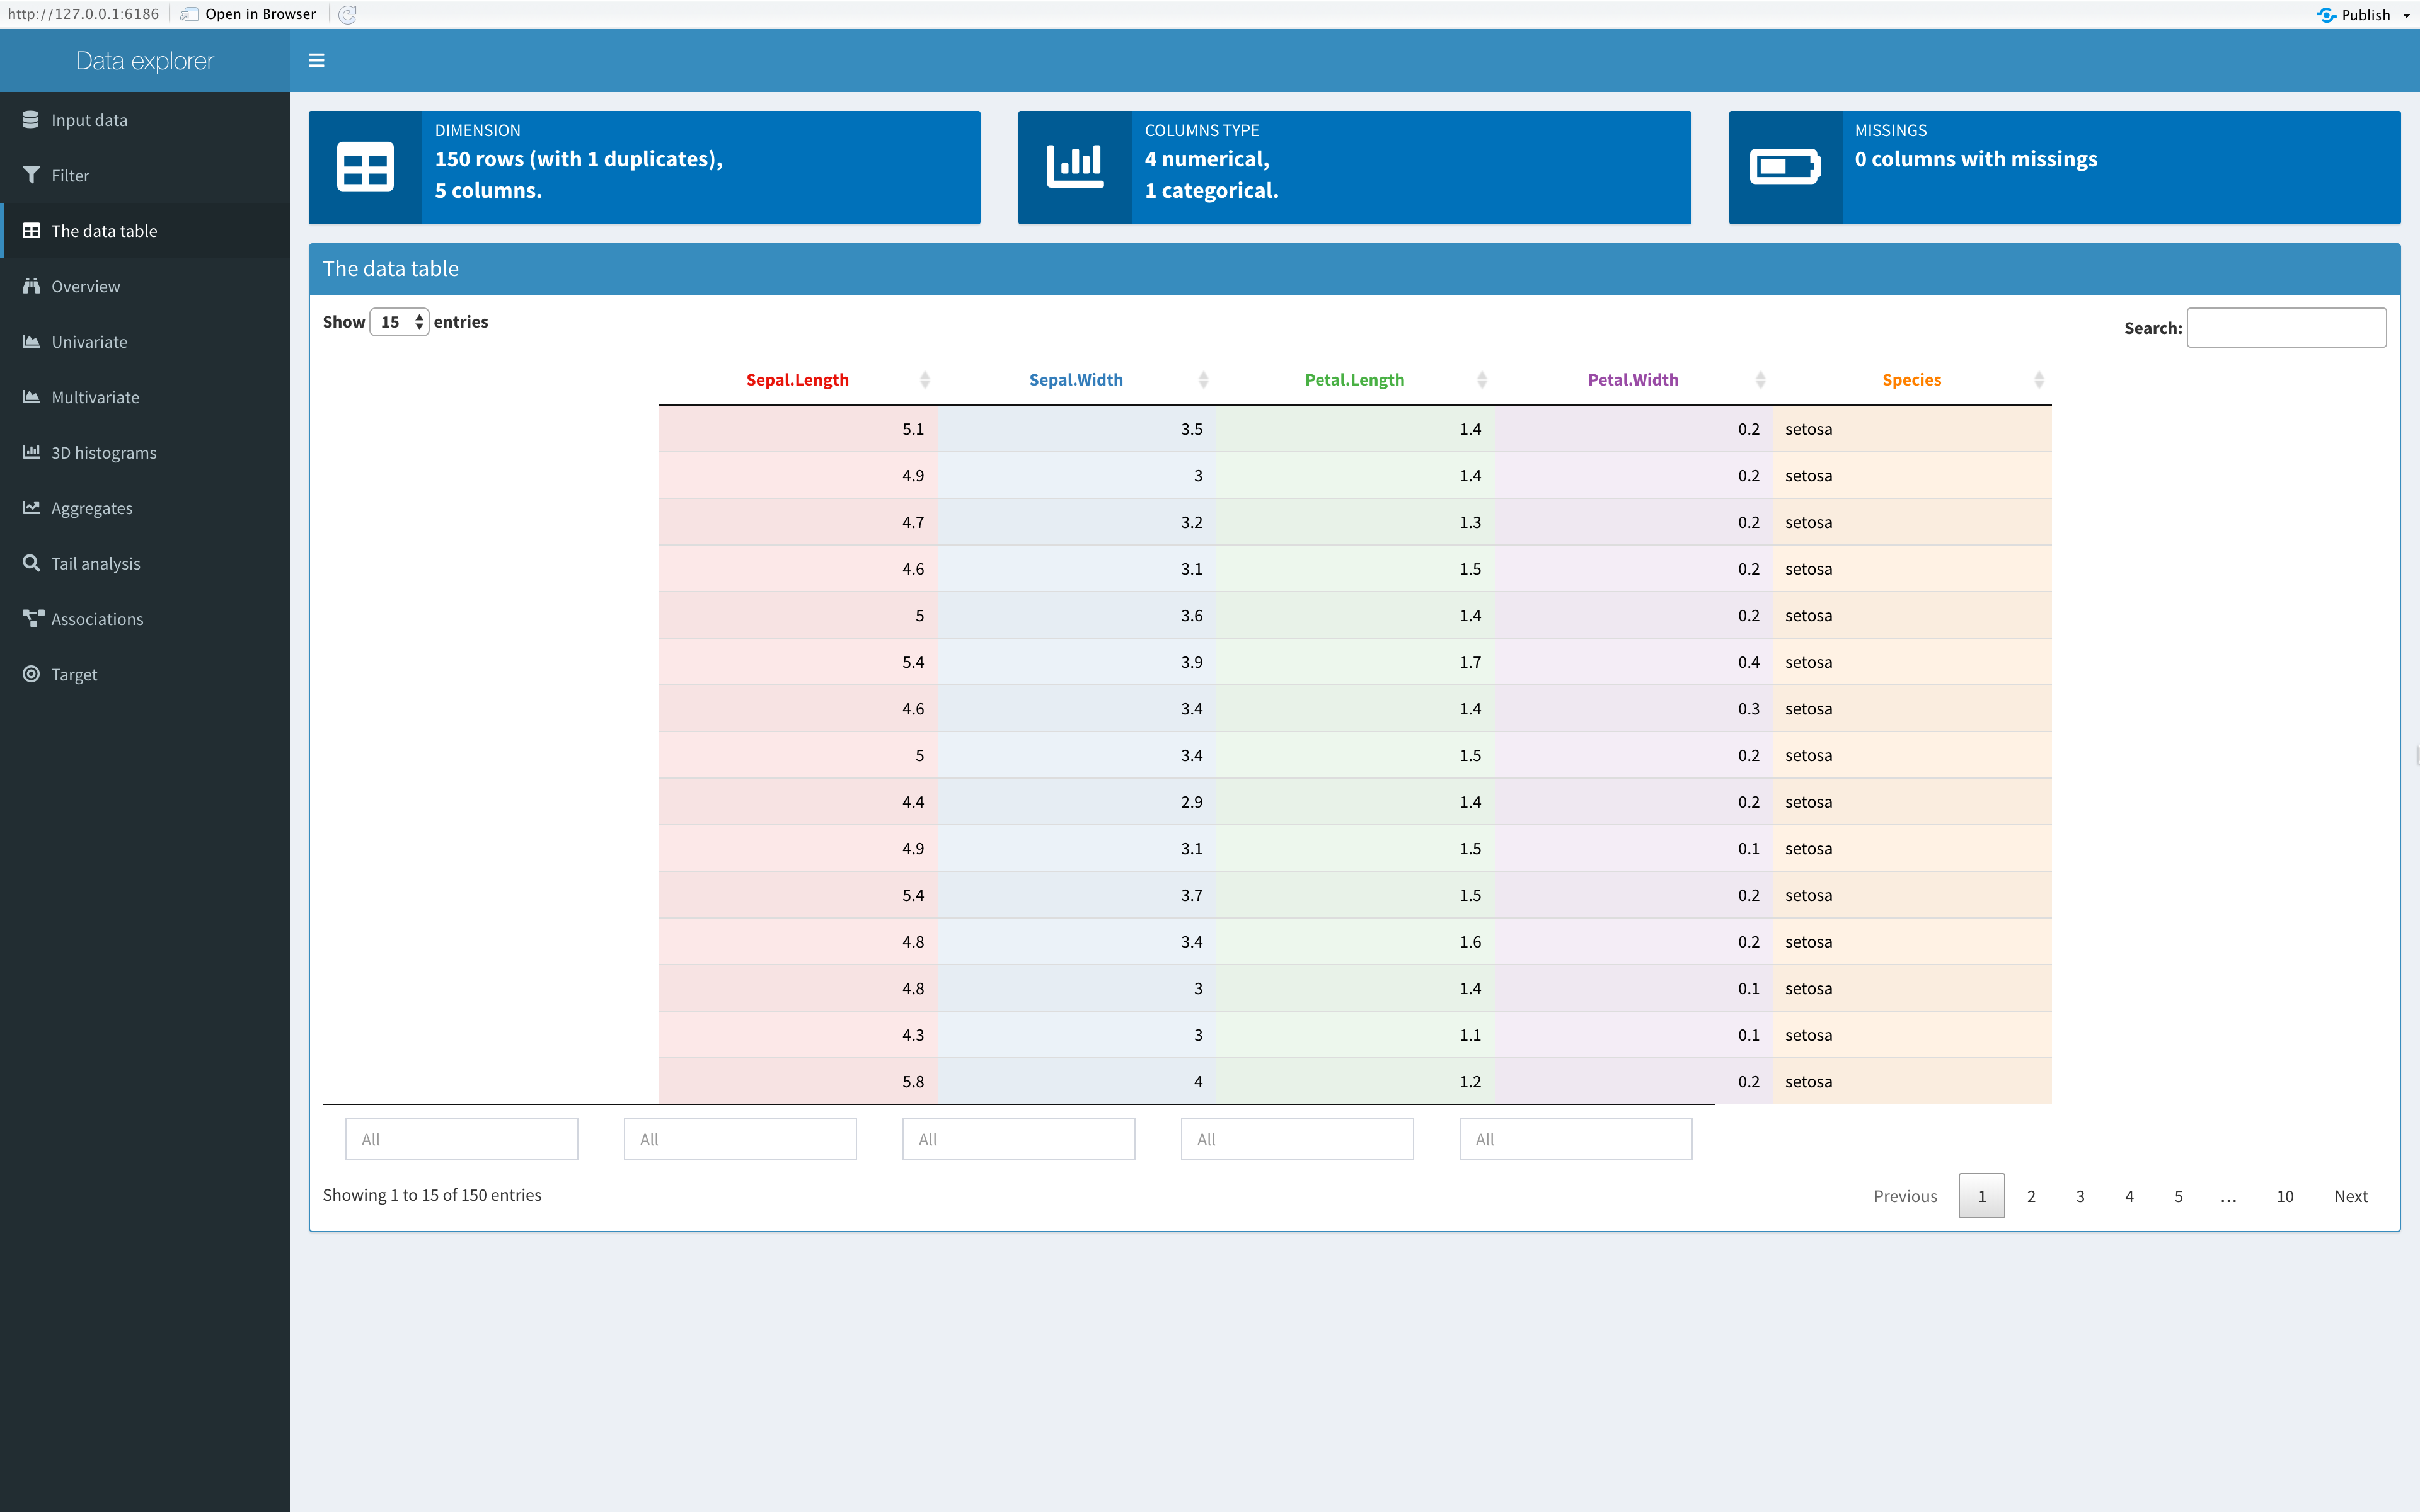
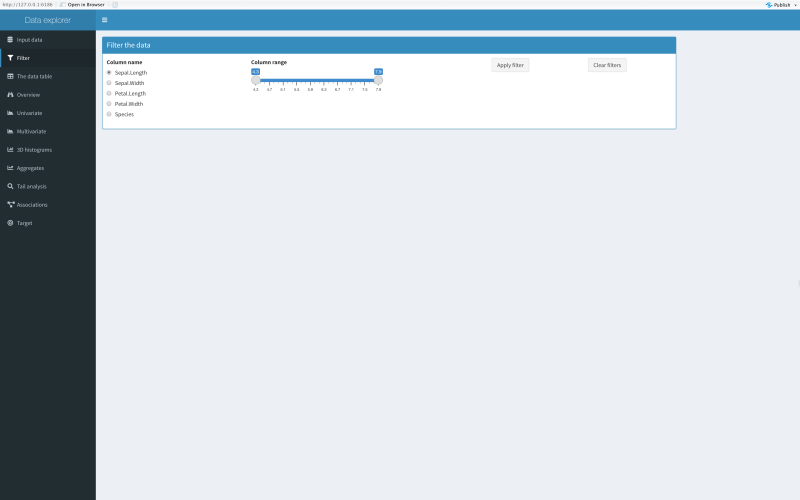 Filter data if necessary. Here no filtration was applied.
 Data in table form presented.
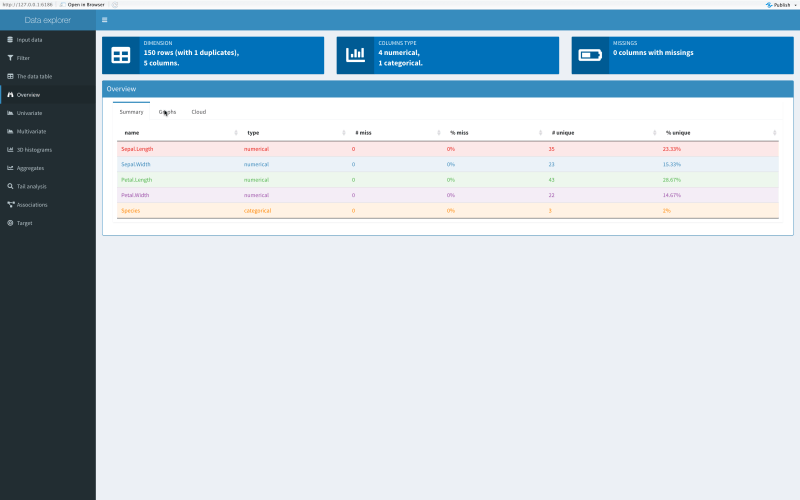 Overview summary info about columns: names, types, missings, uniques.
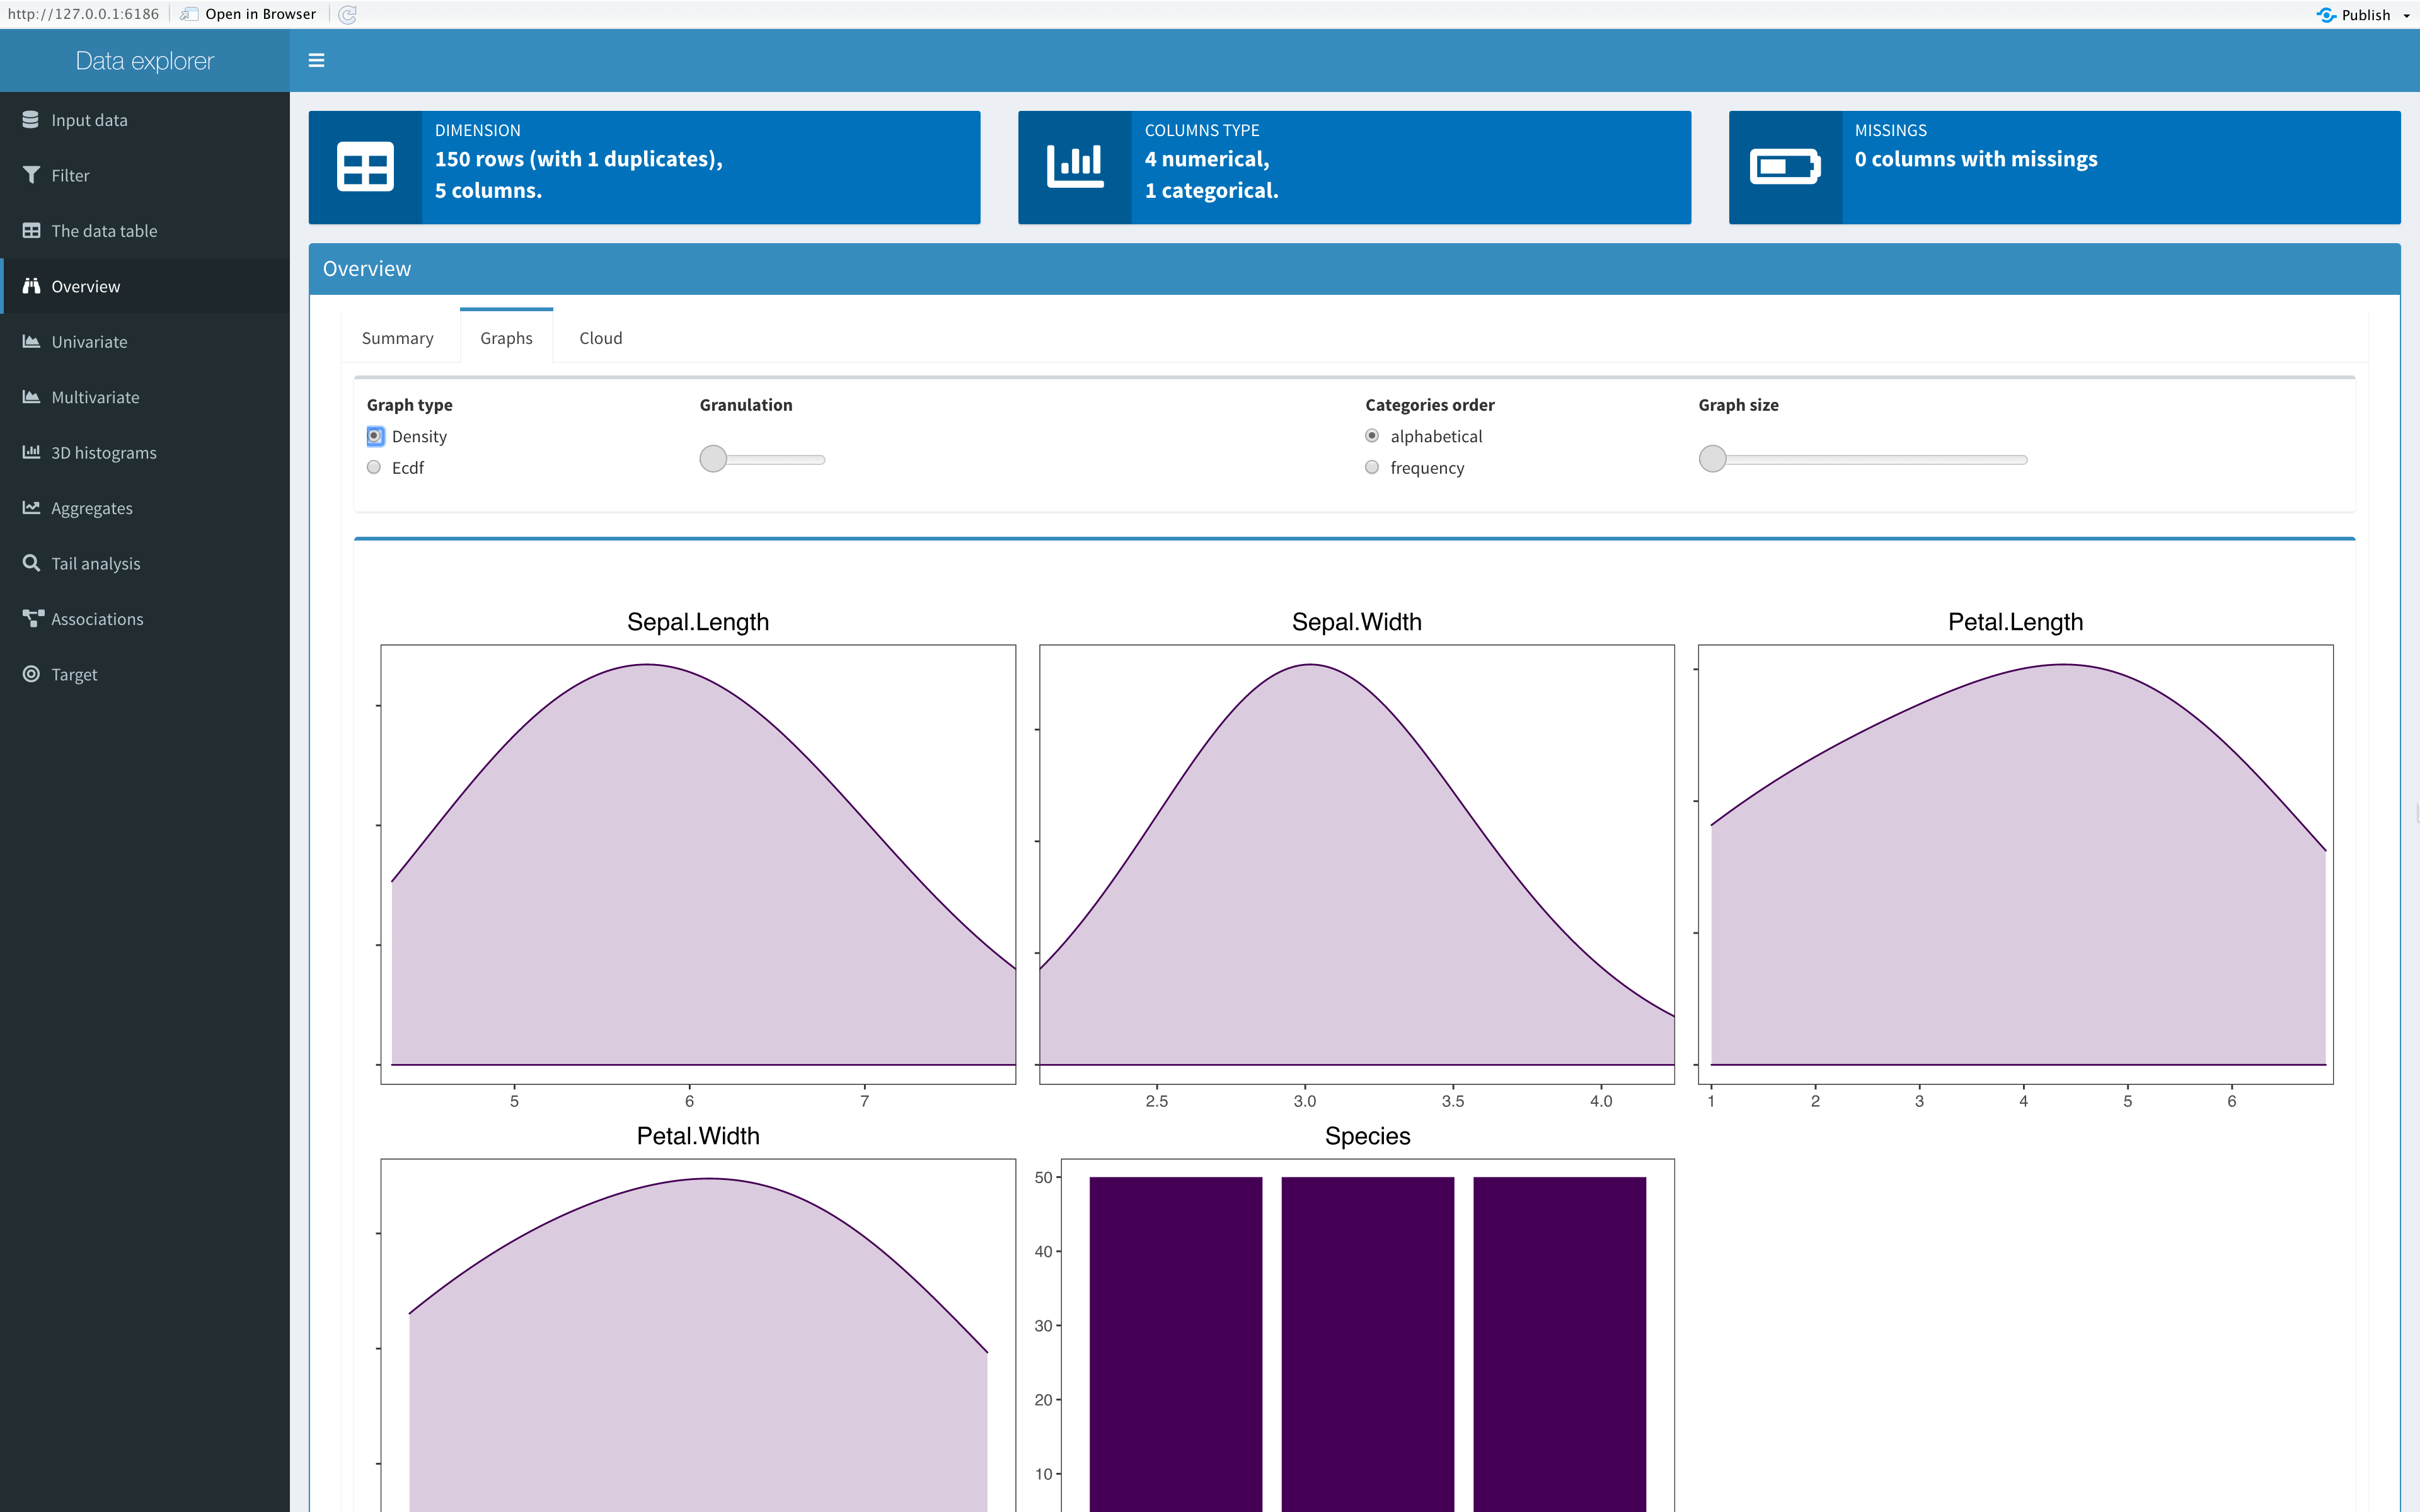
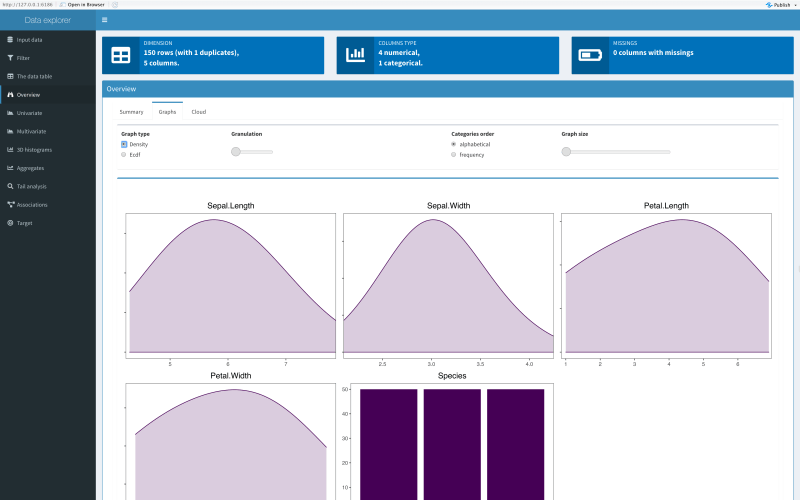 Densities of all the columns.
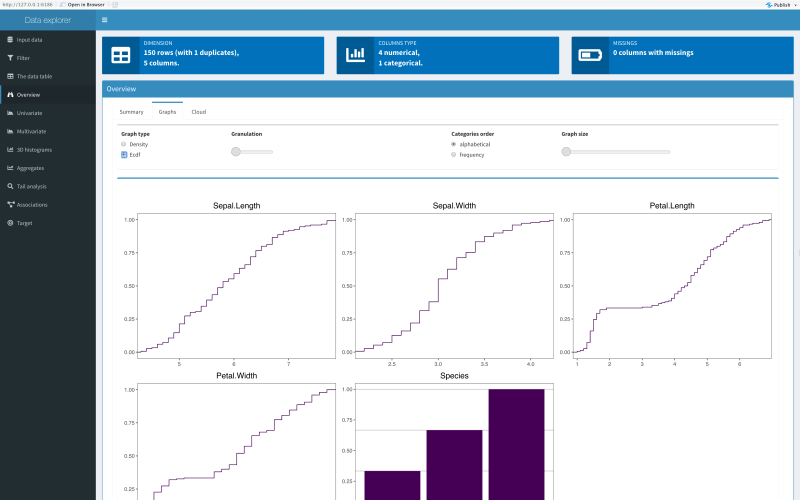 Empirical cumulative distribution functions for all the columns.
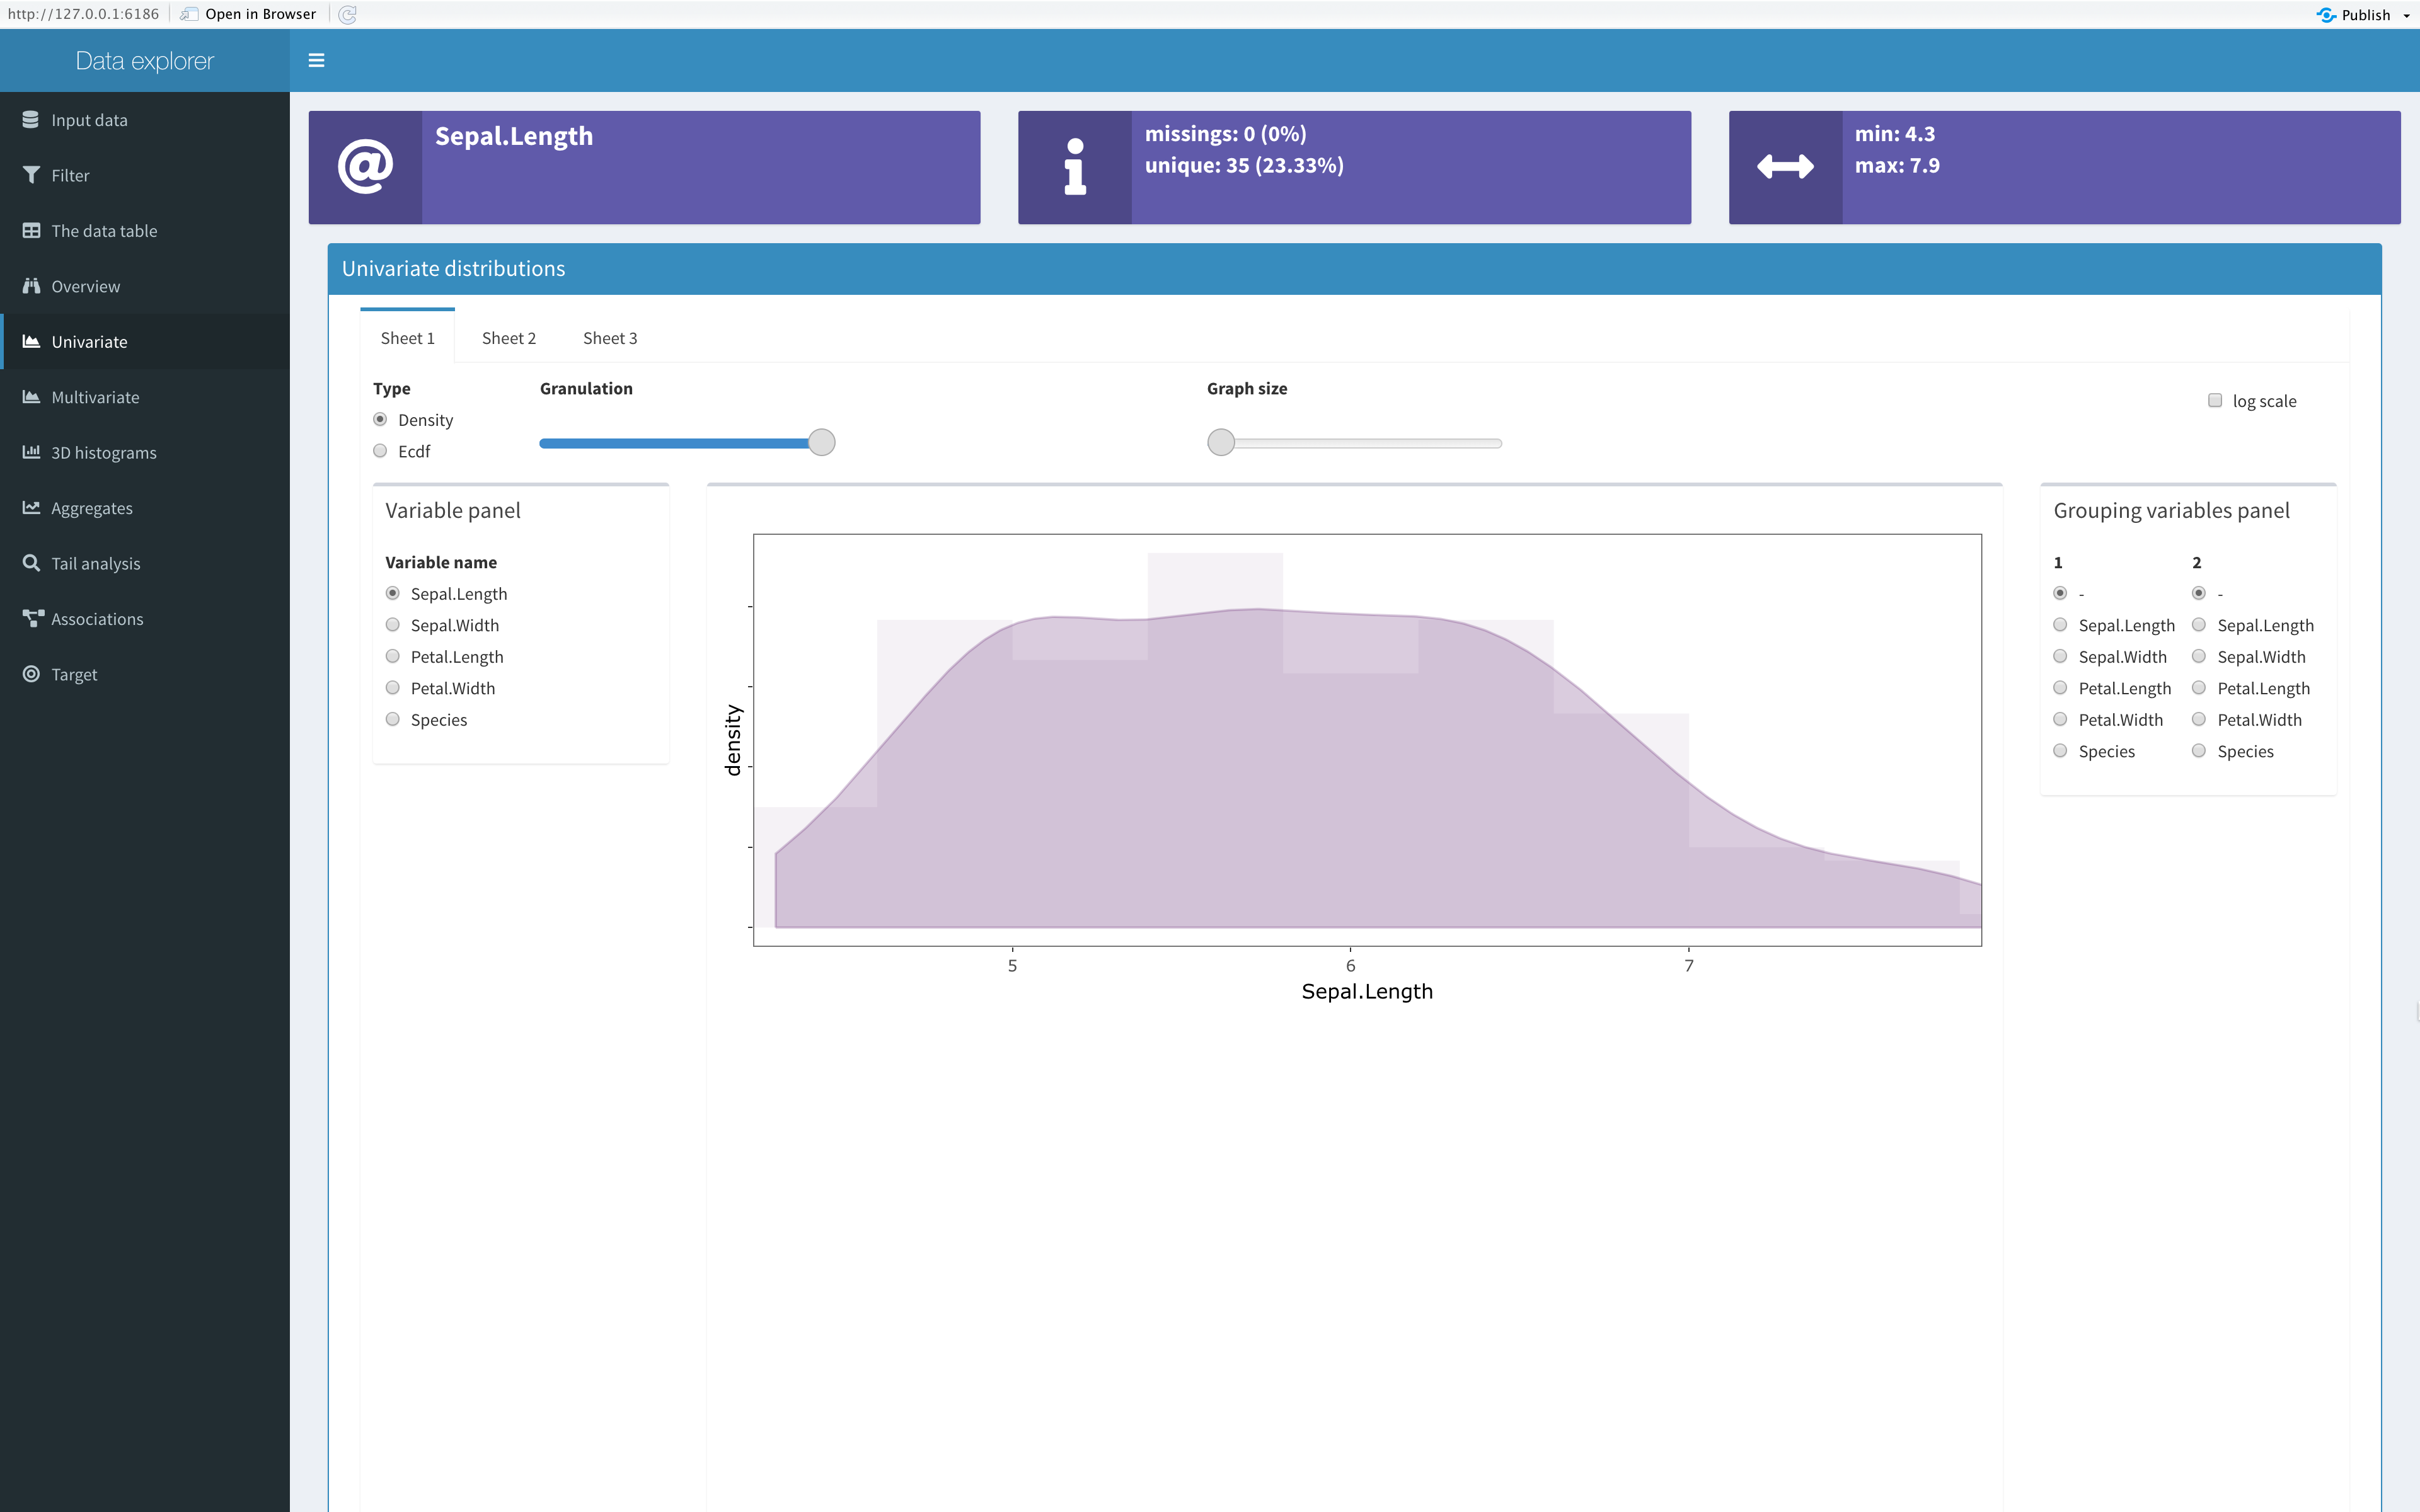
 Univariate density (histogram) of sepal length.
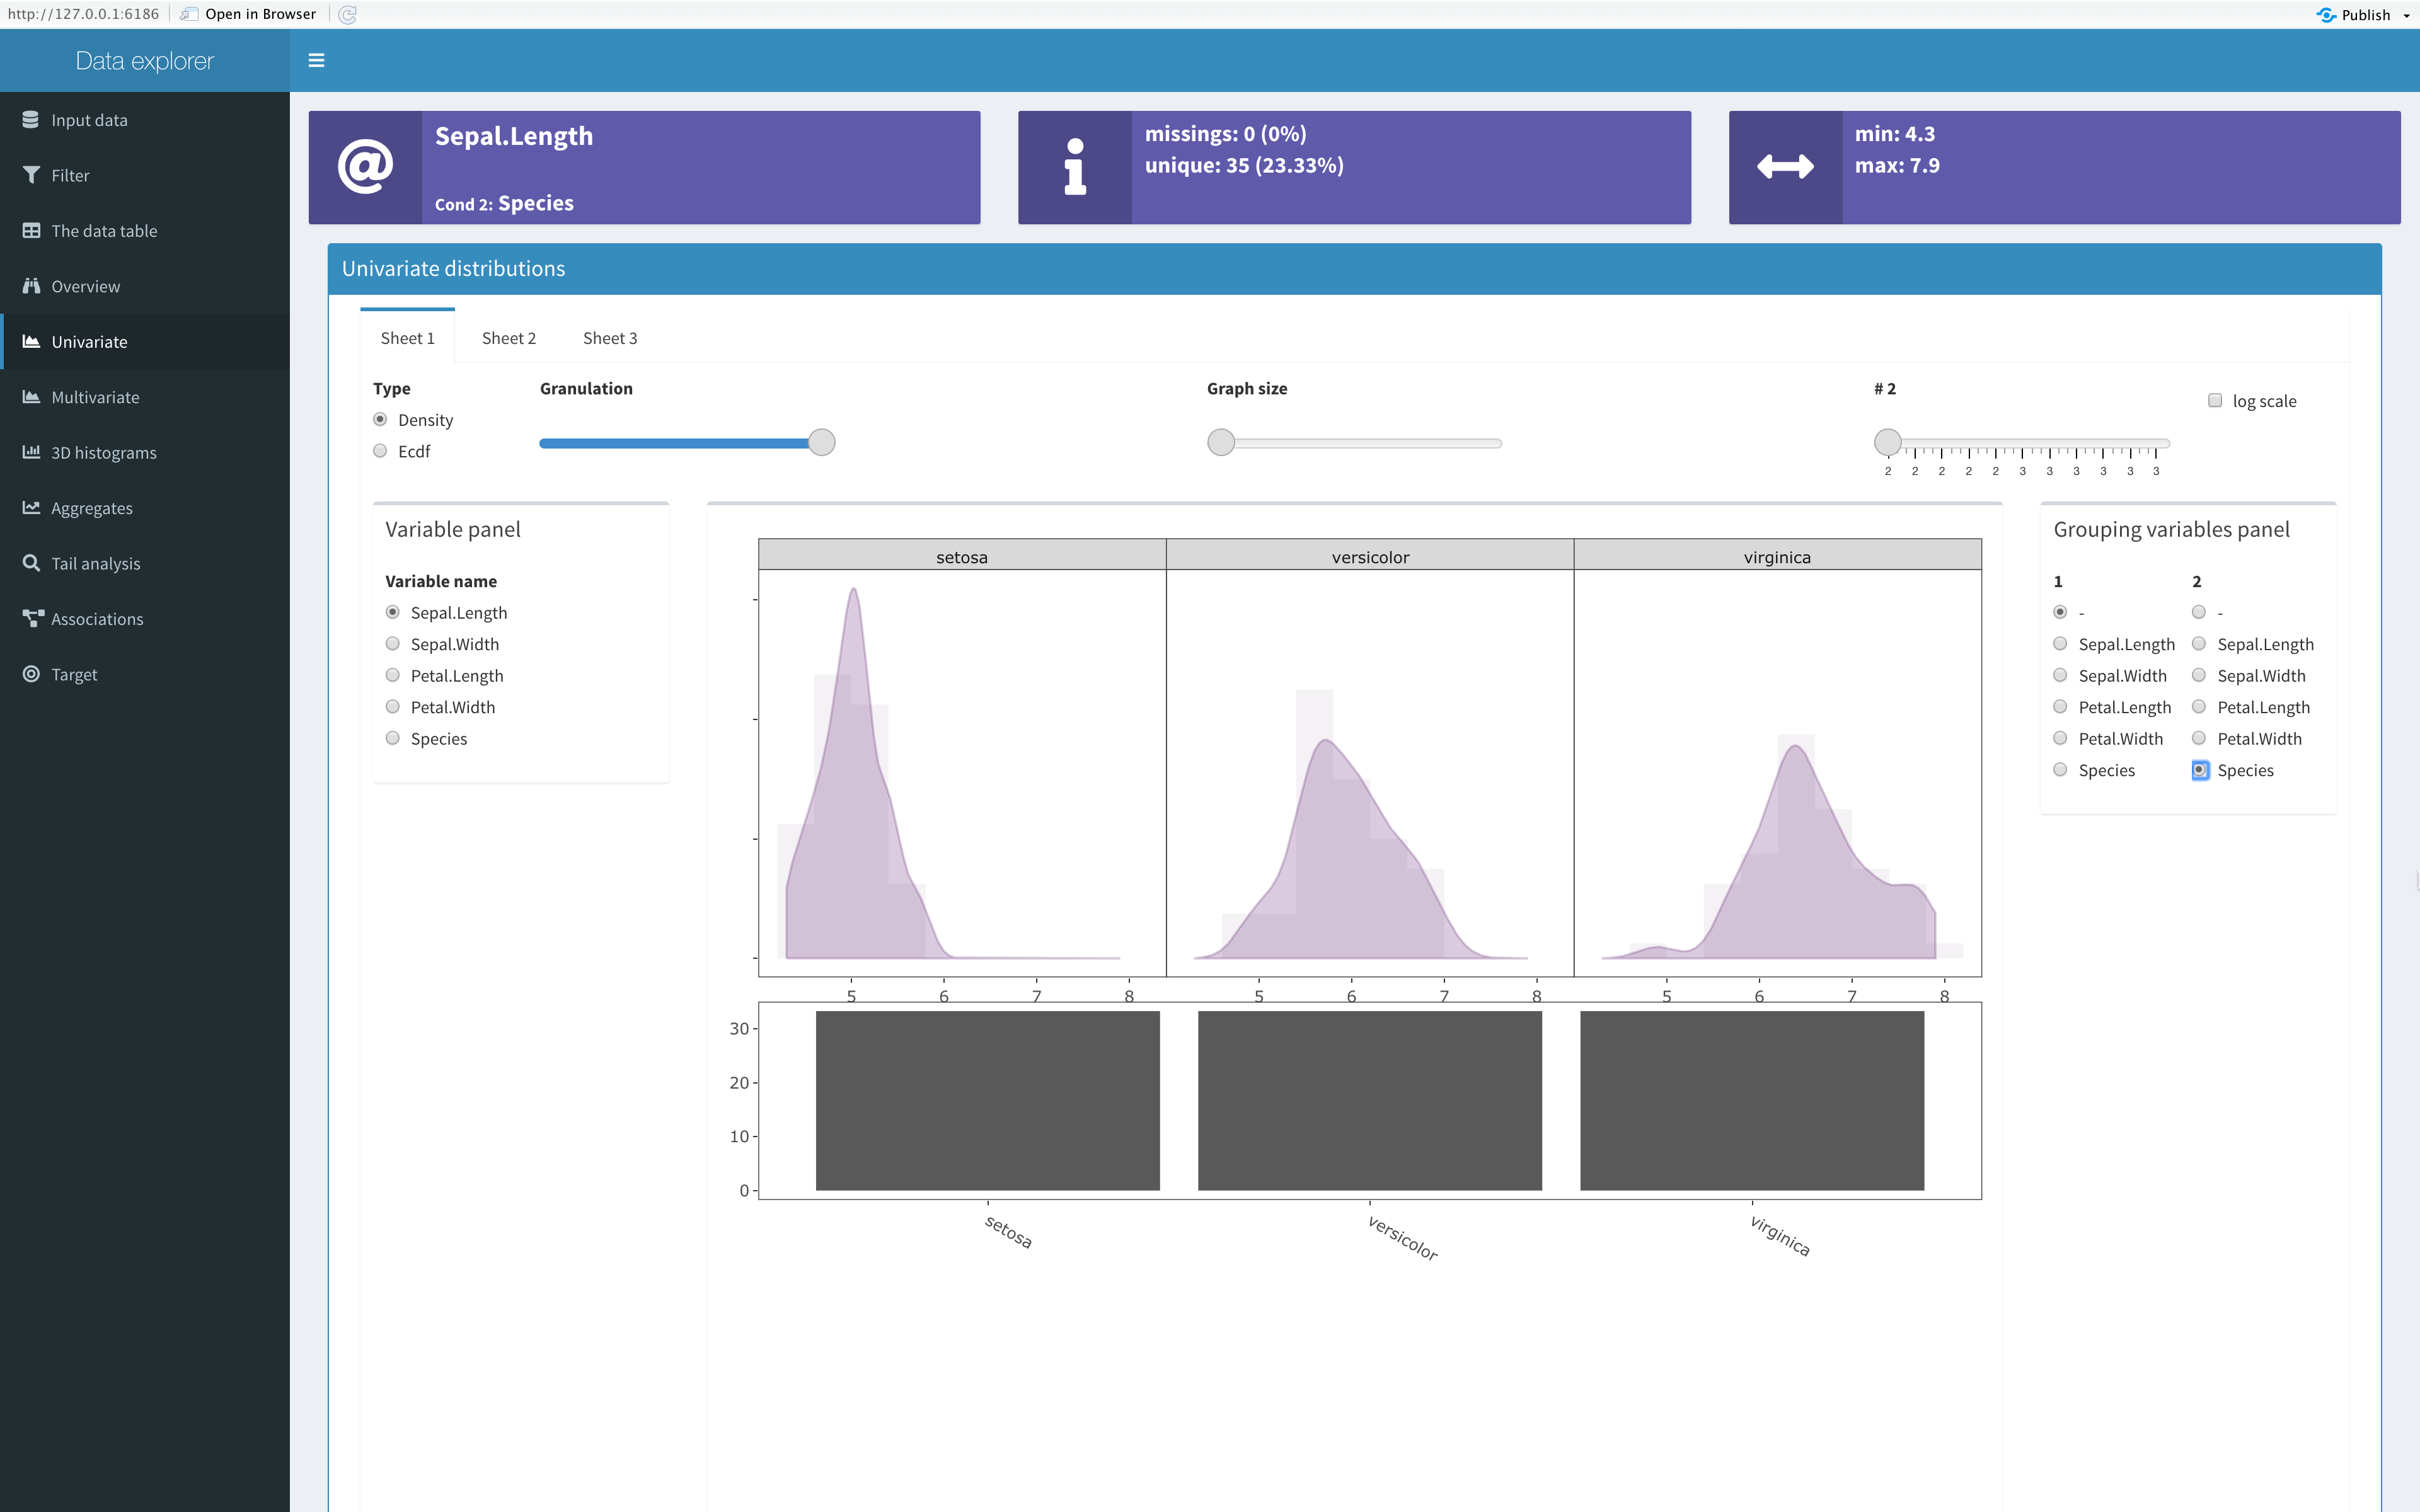
 Density of sepal length for each species.
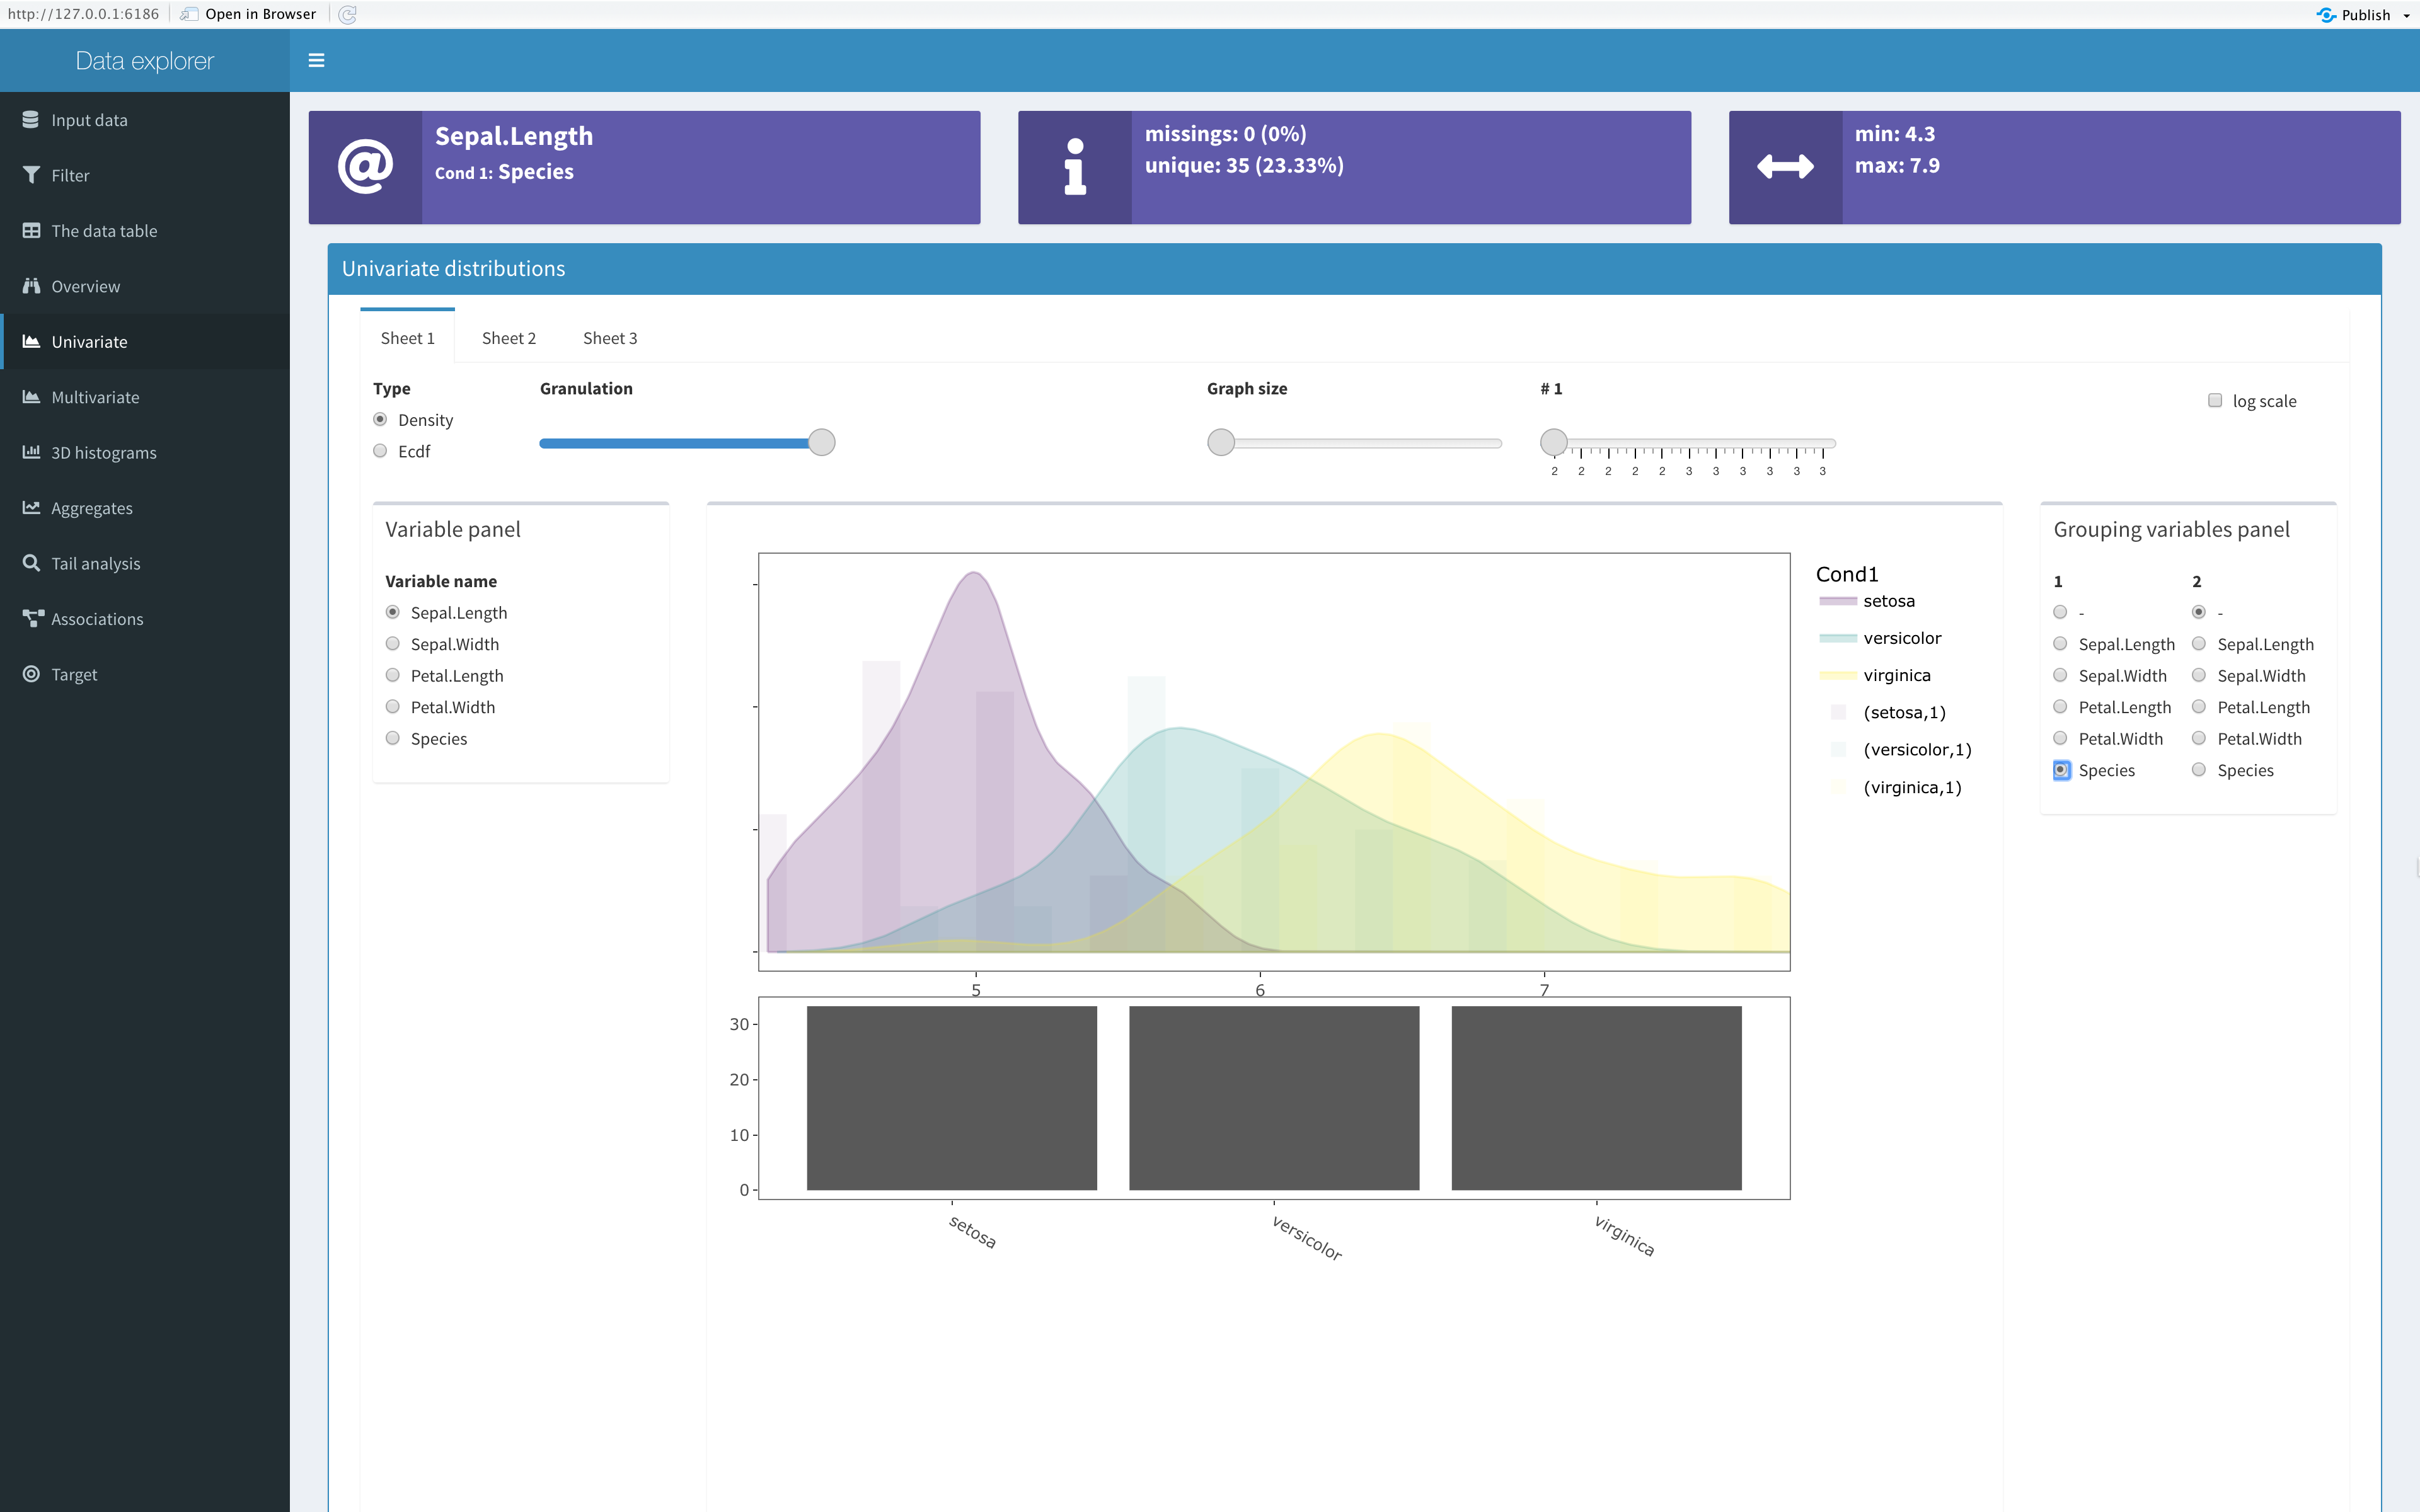
 Density of sepal length for each species in different graphs.
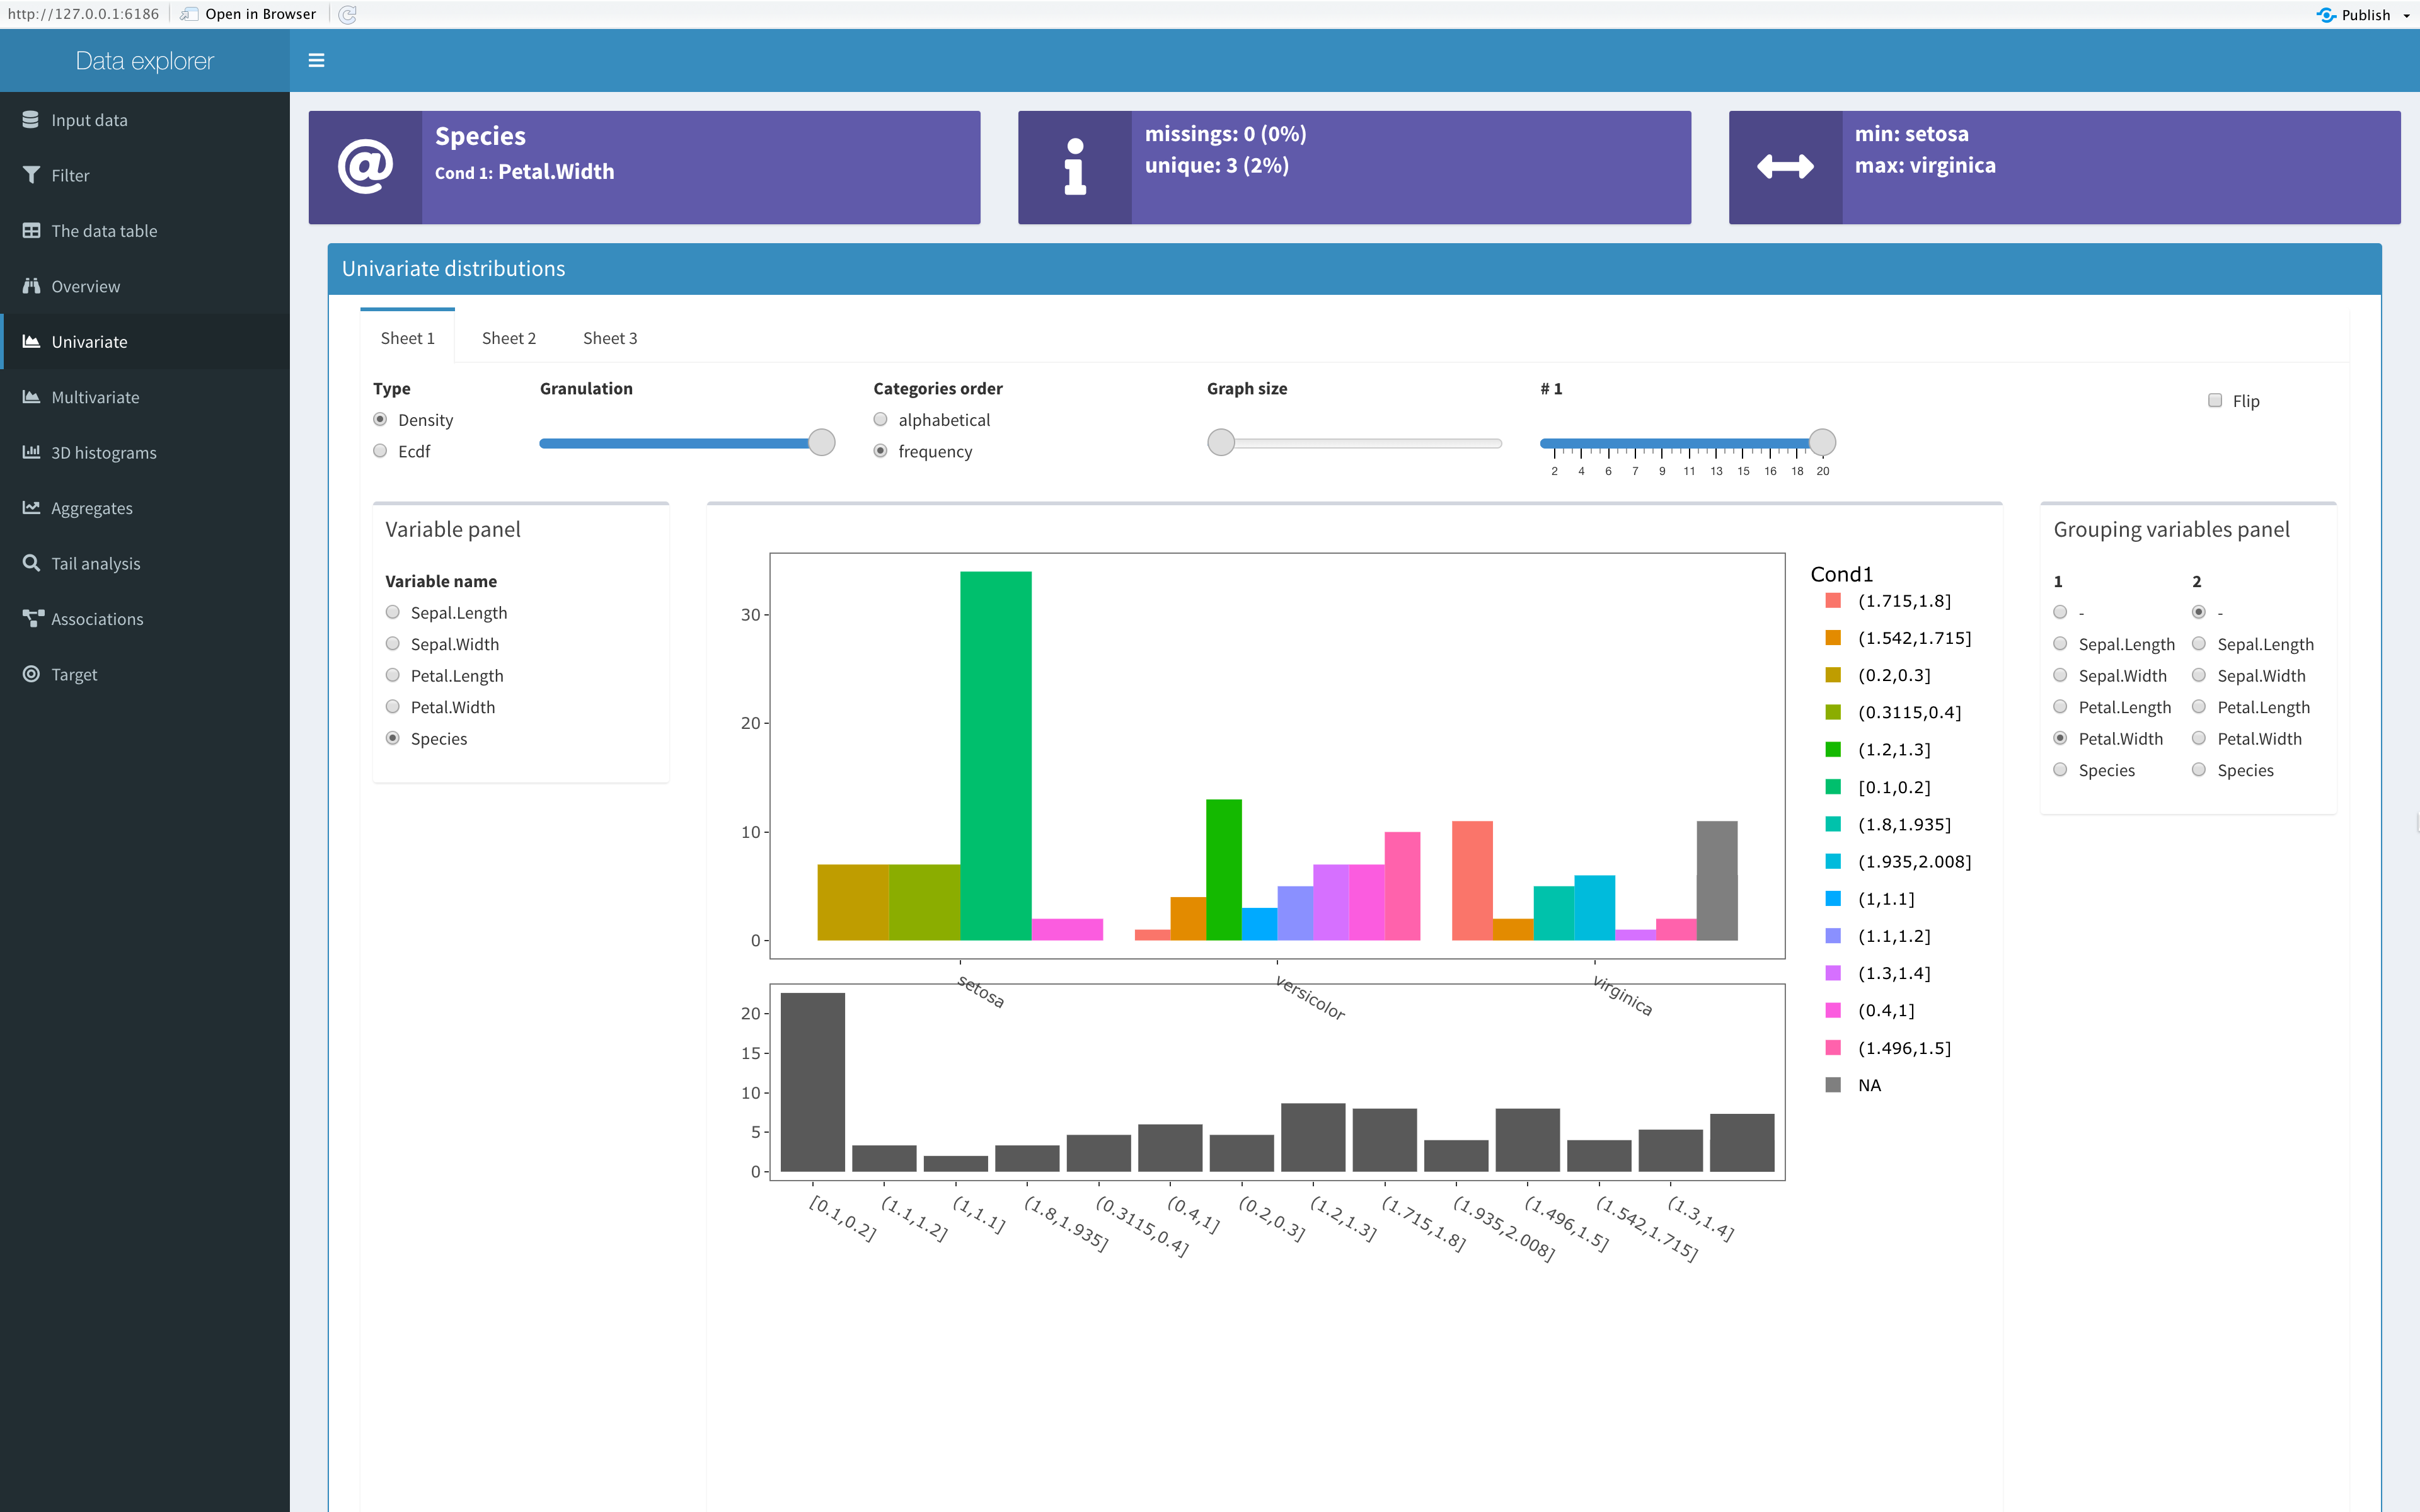
 Species distribution (upper) for different petal width intervals (set by slider #1) and petal width intervals distribution (lower).
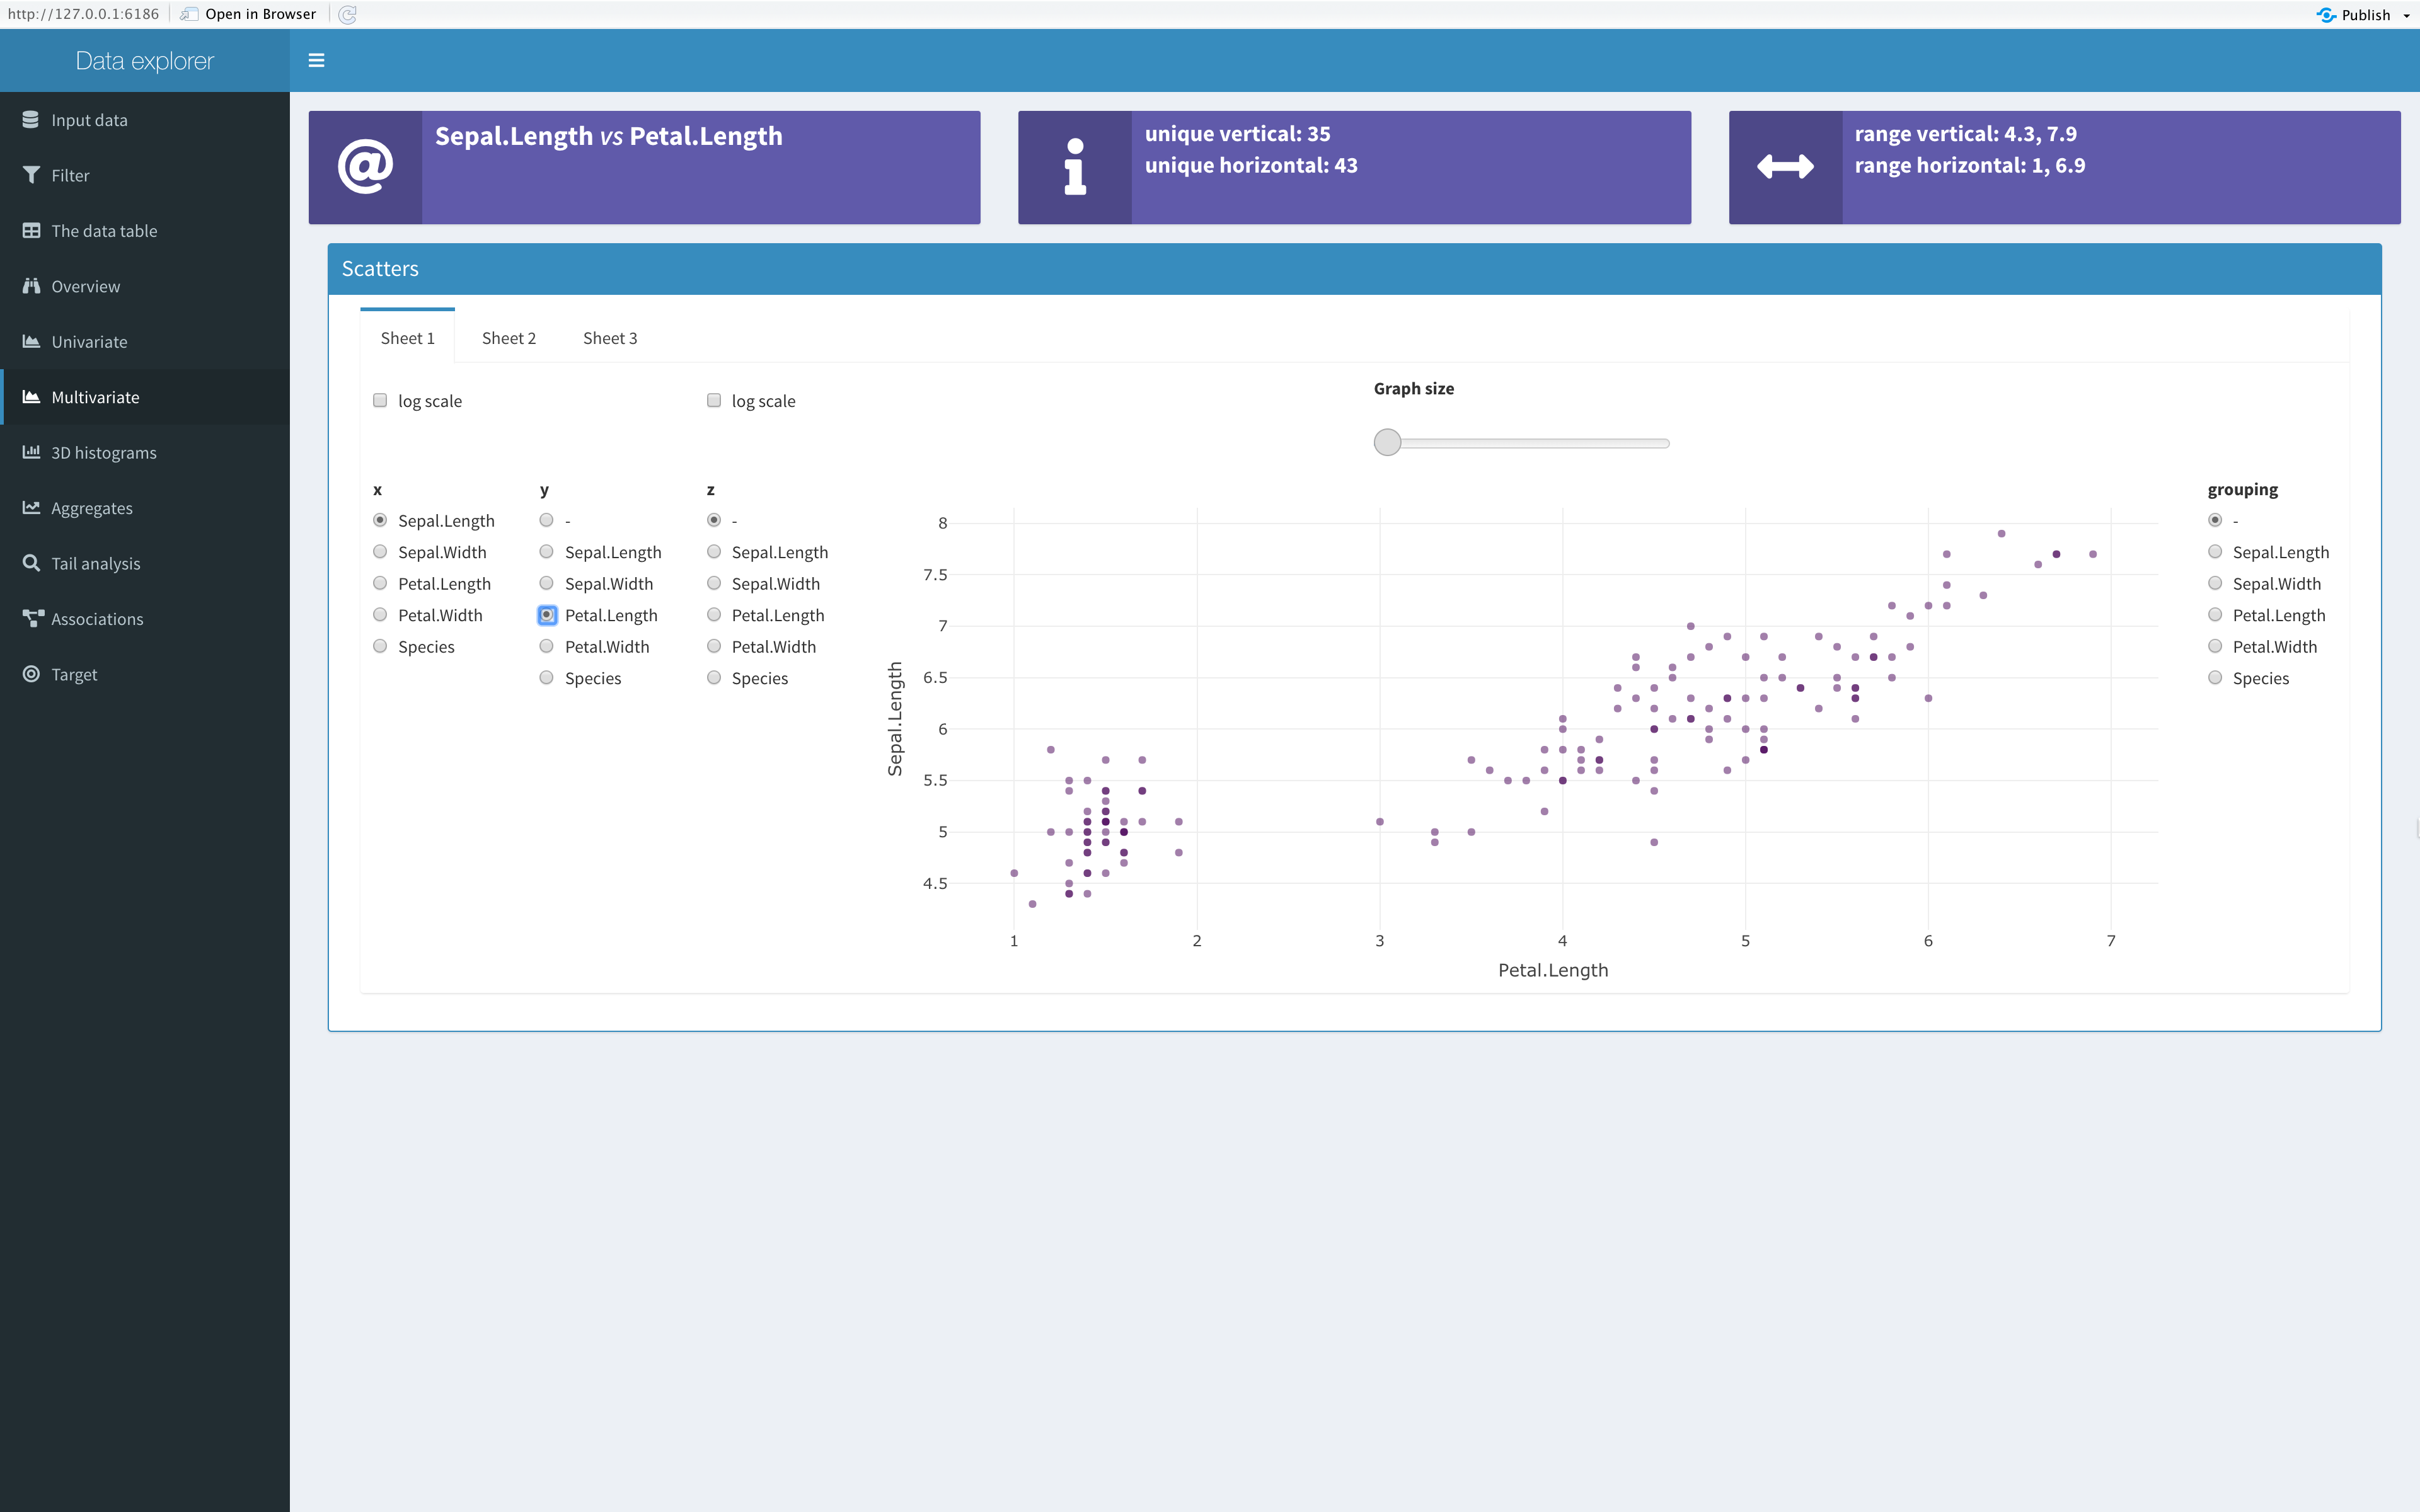
 Scatter plot of sepal and petal lengths.
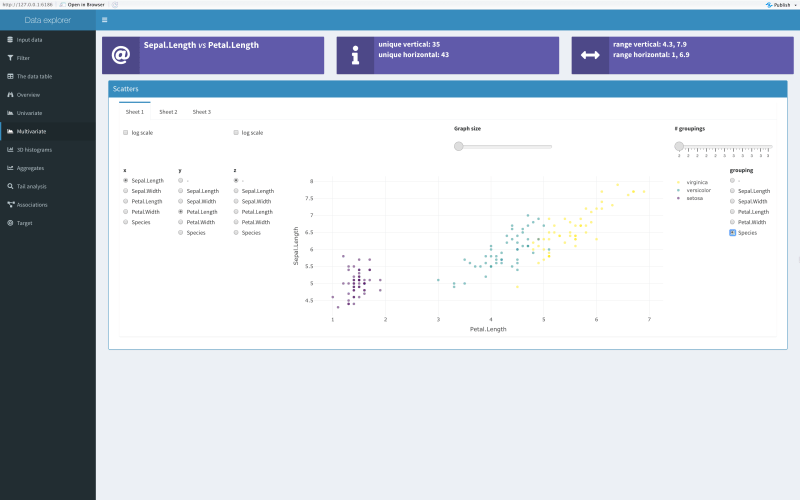 Scatter plot of sepal and petal lengths with different colors for each species.
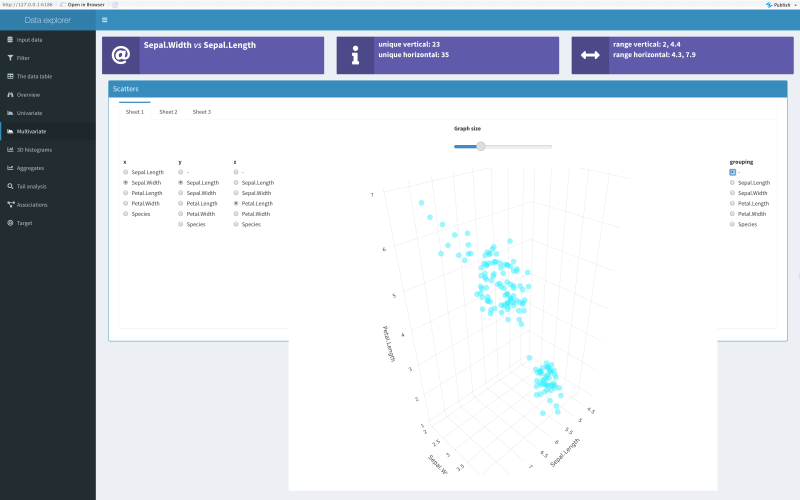 3D scatter plot of sepal width, sepal length, and petal length.
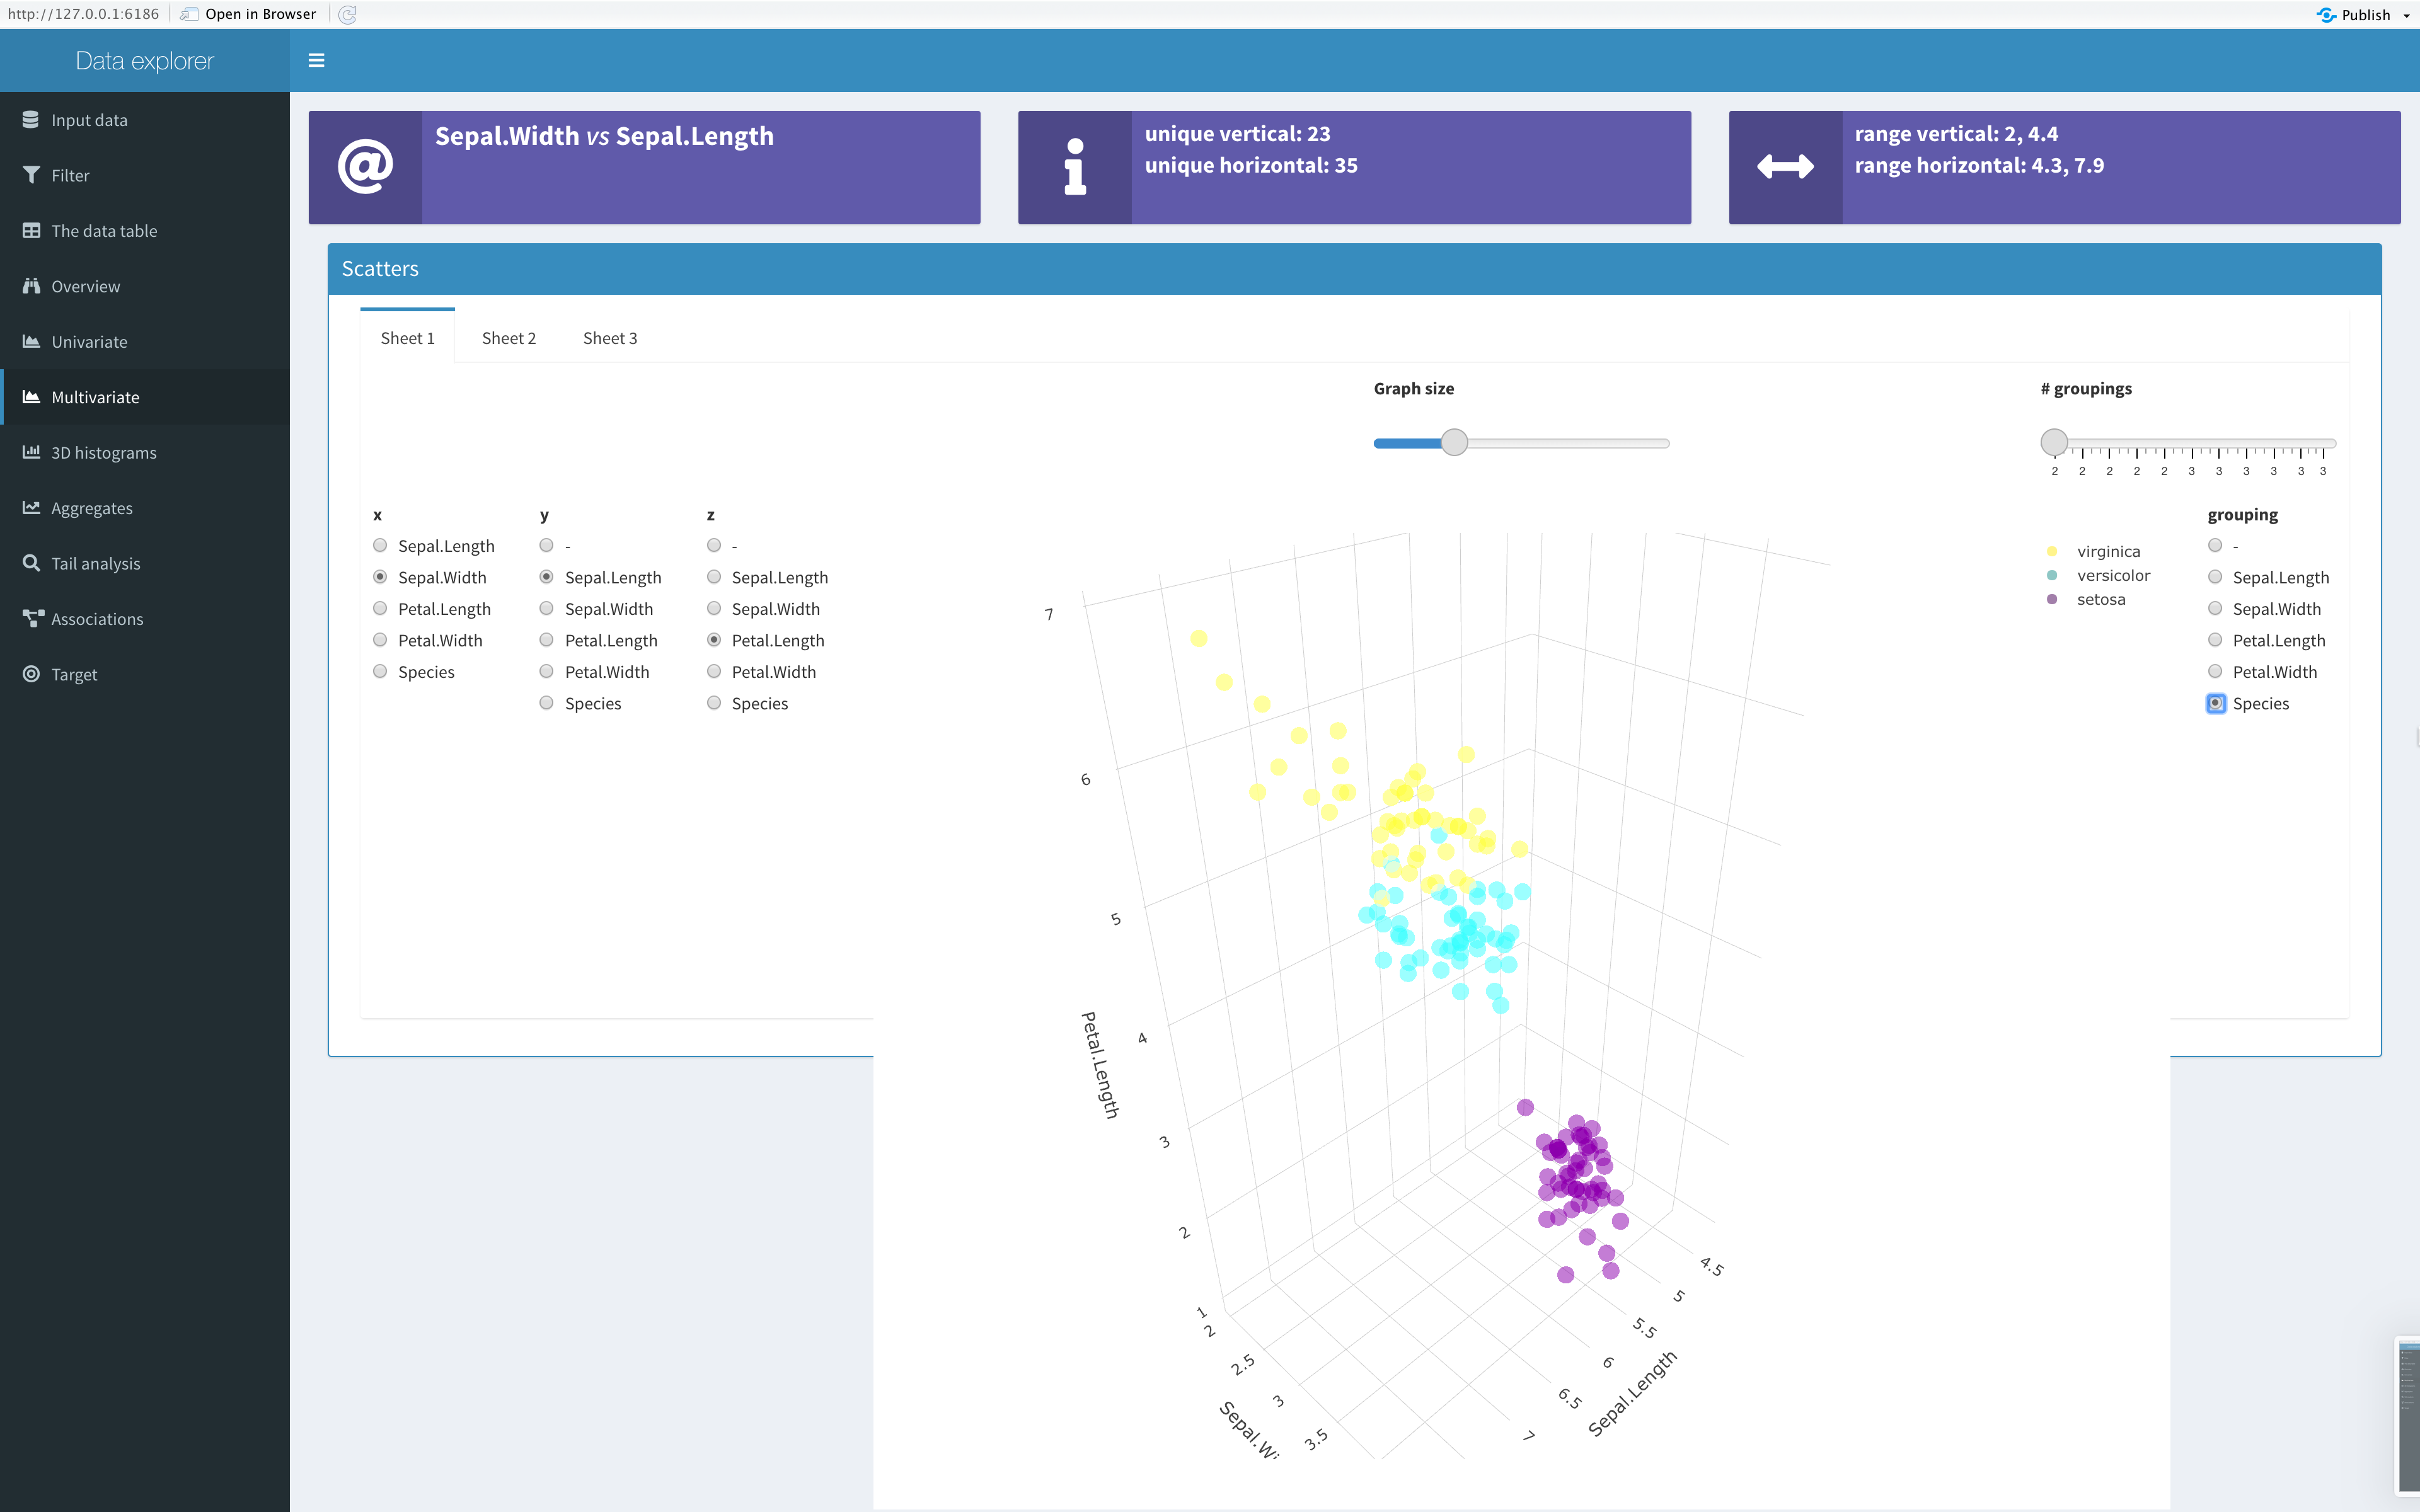
 3D scatter plot of sepal width, sepal length, and petal length with different colors for each species.
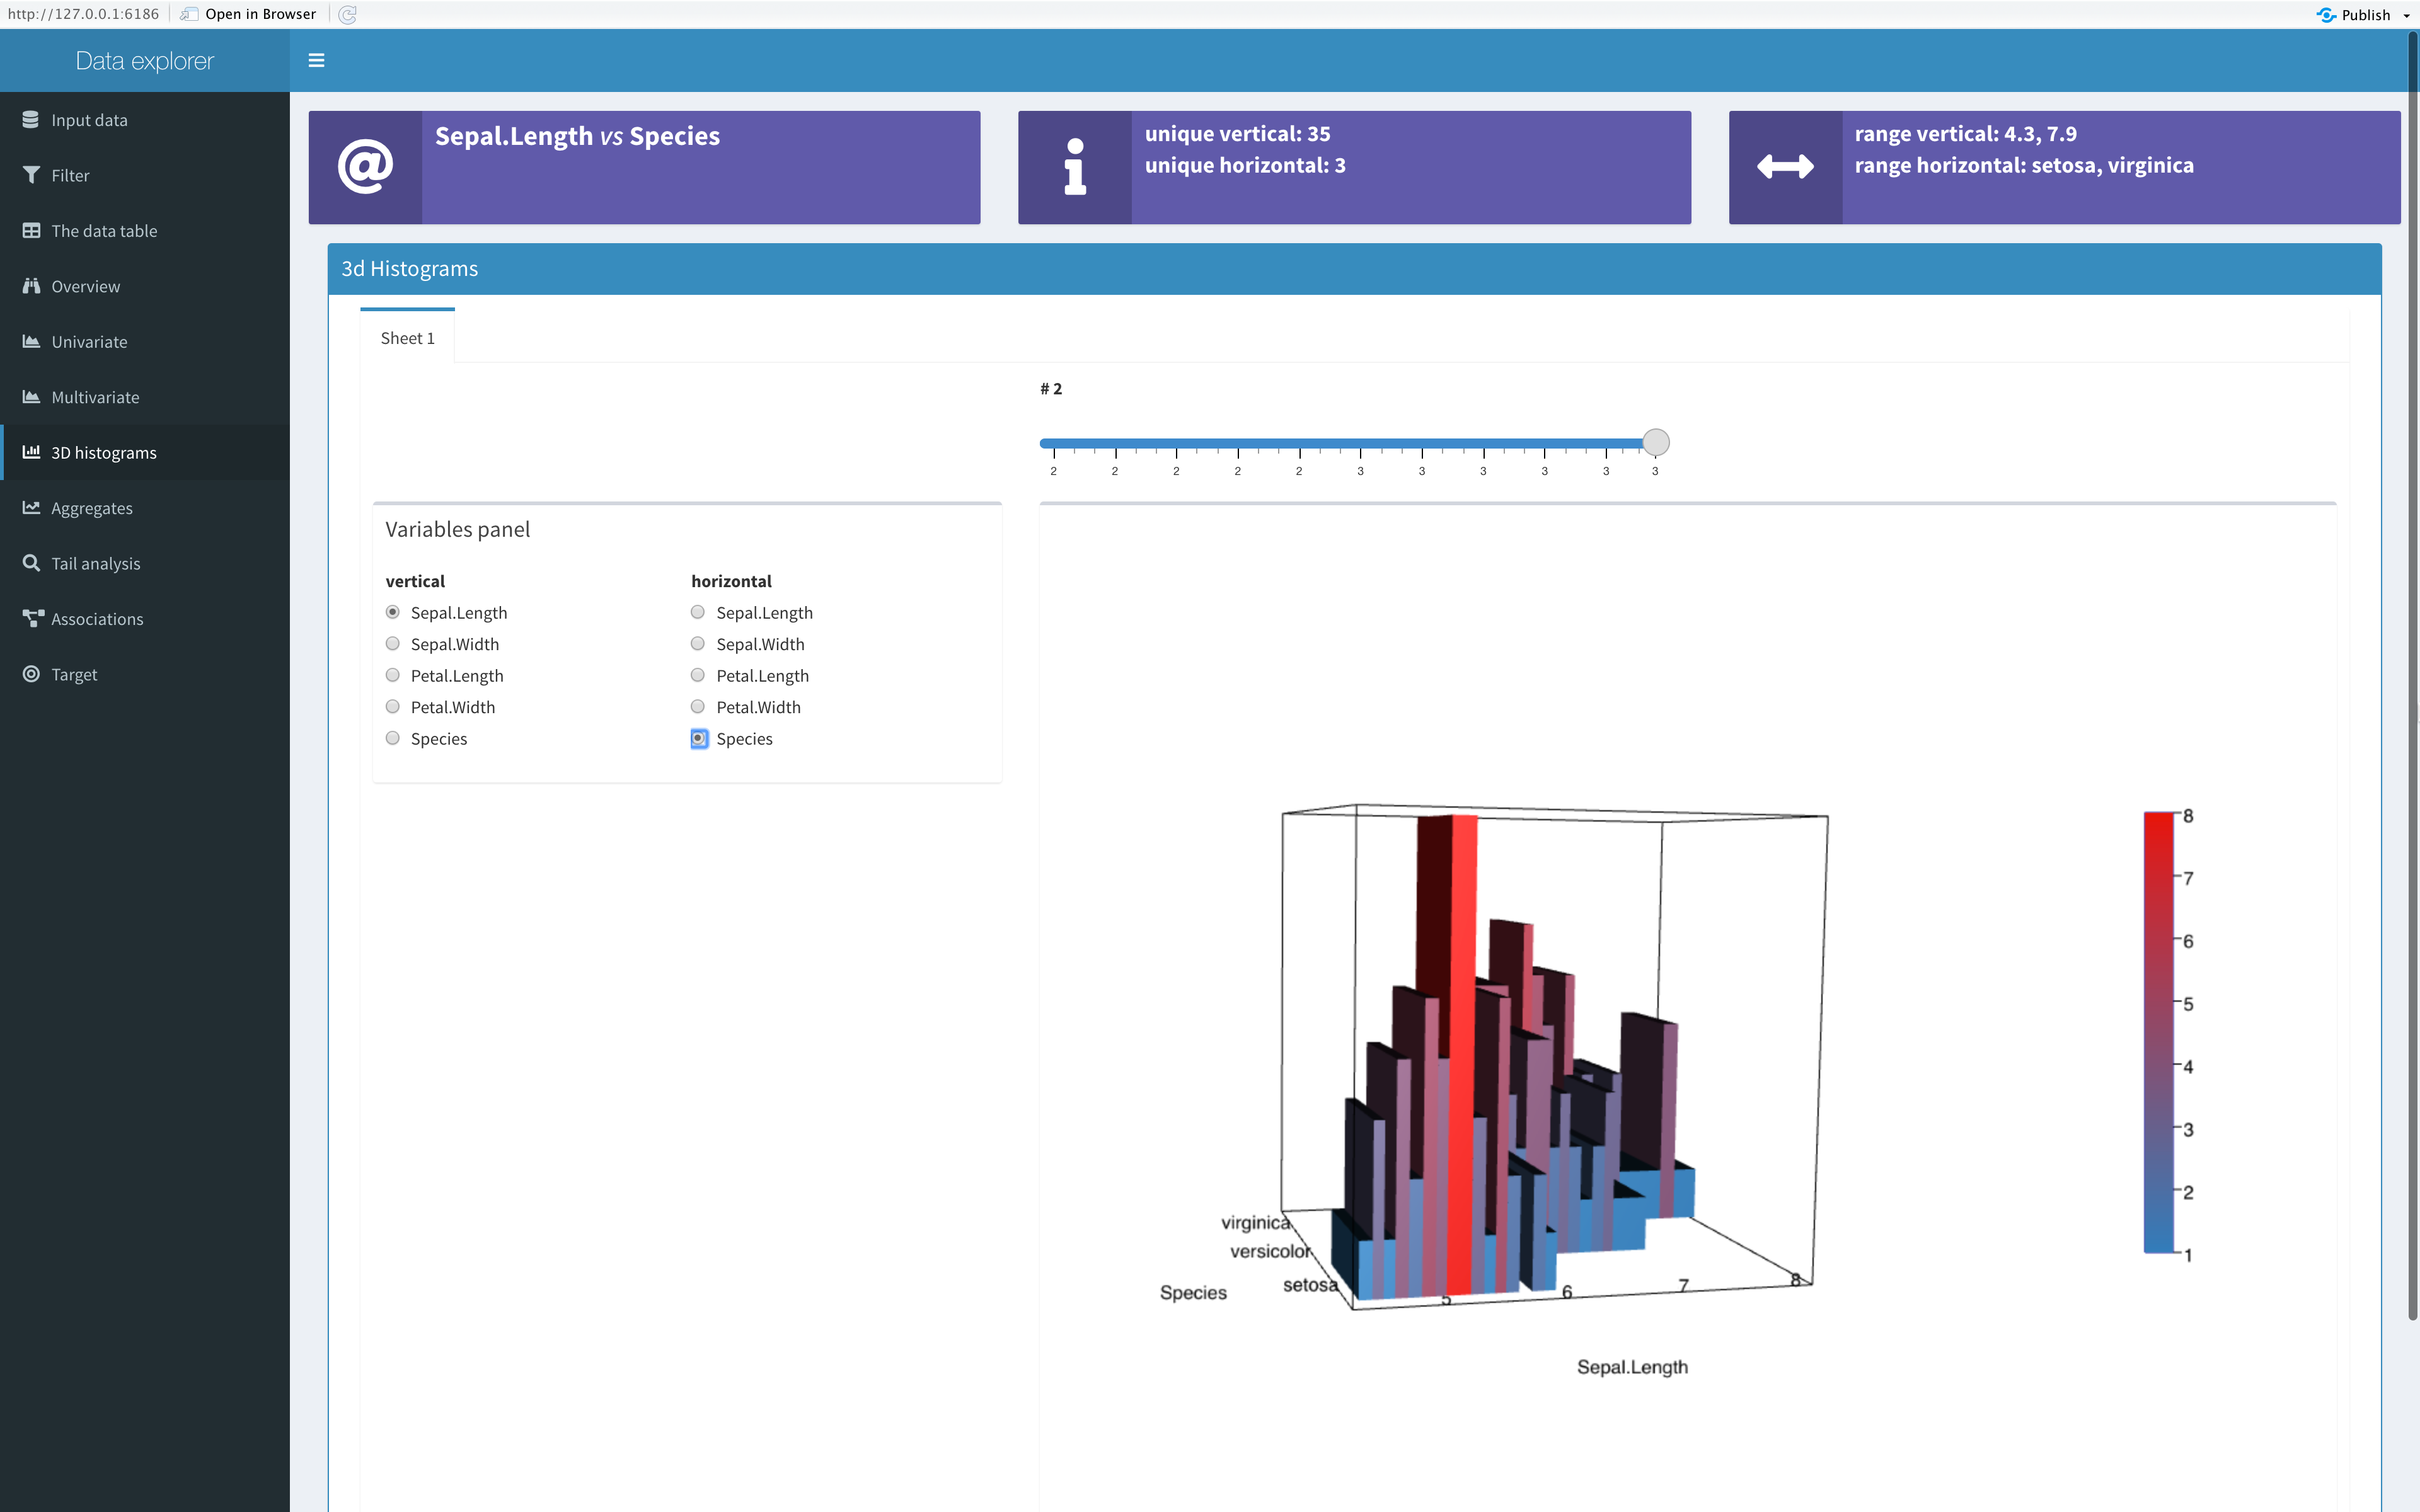
 3D histogram of sepal length and species.
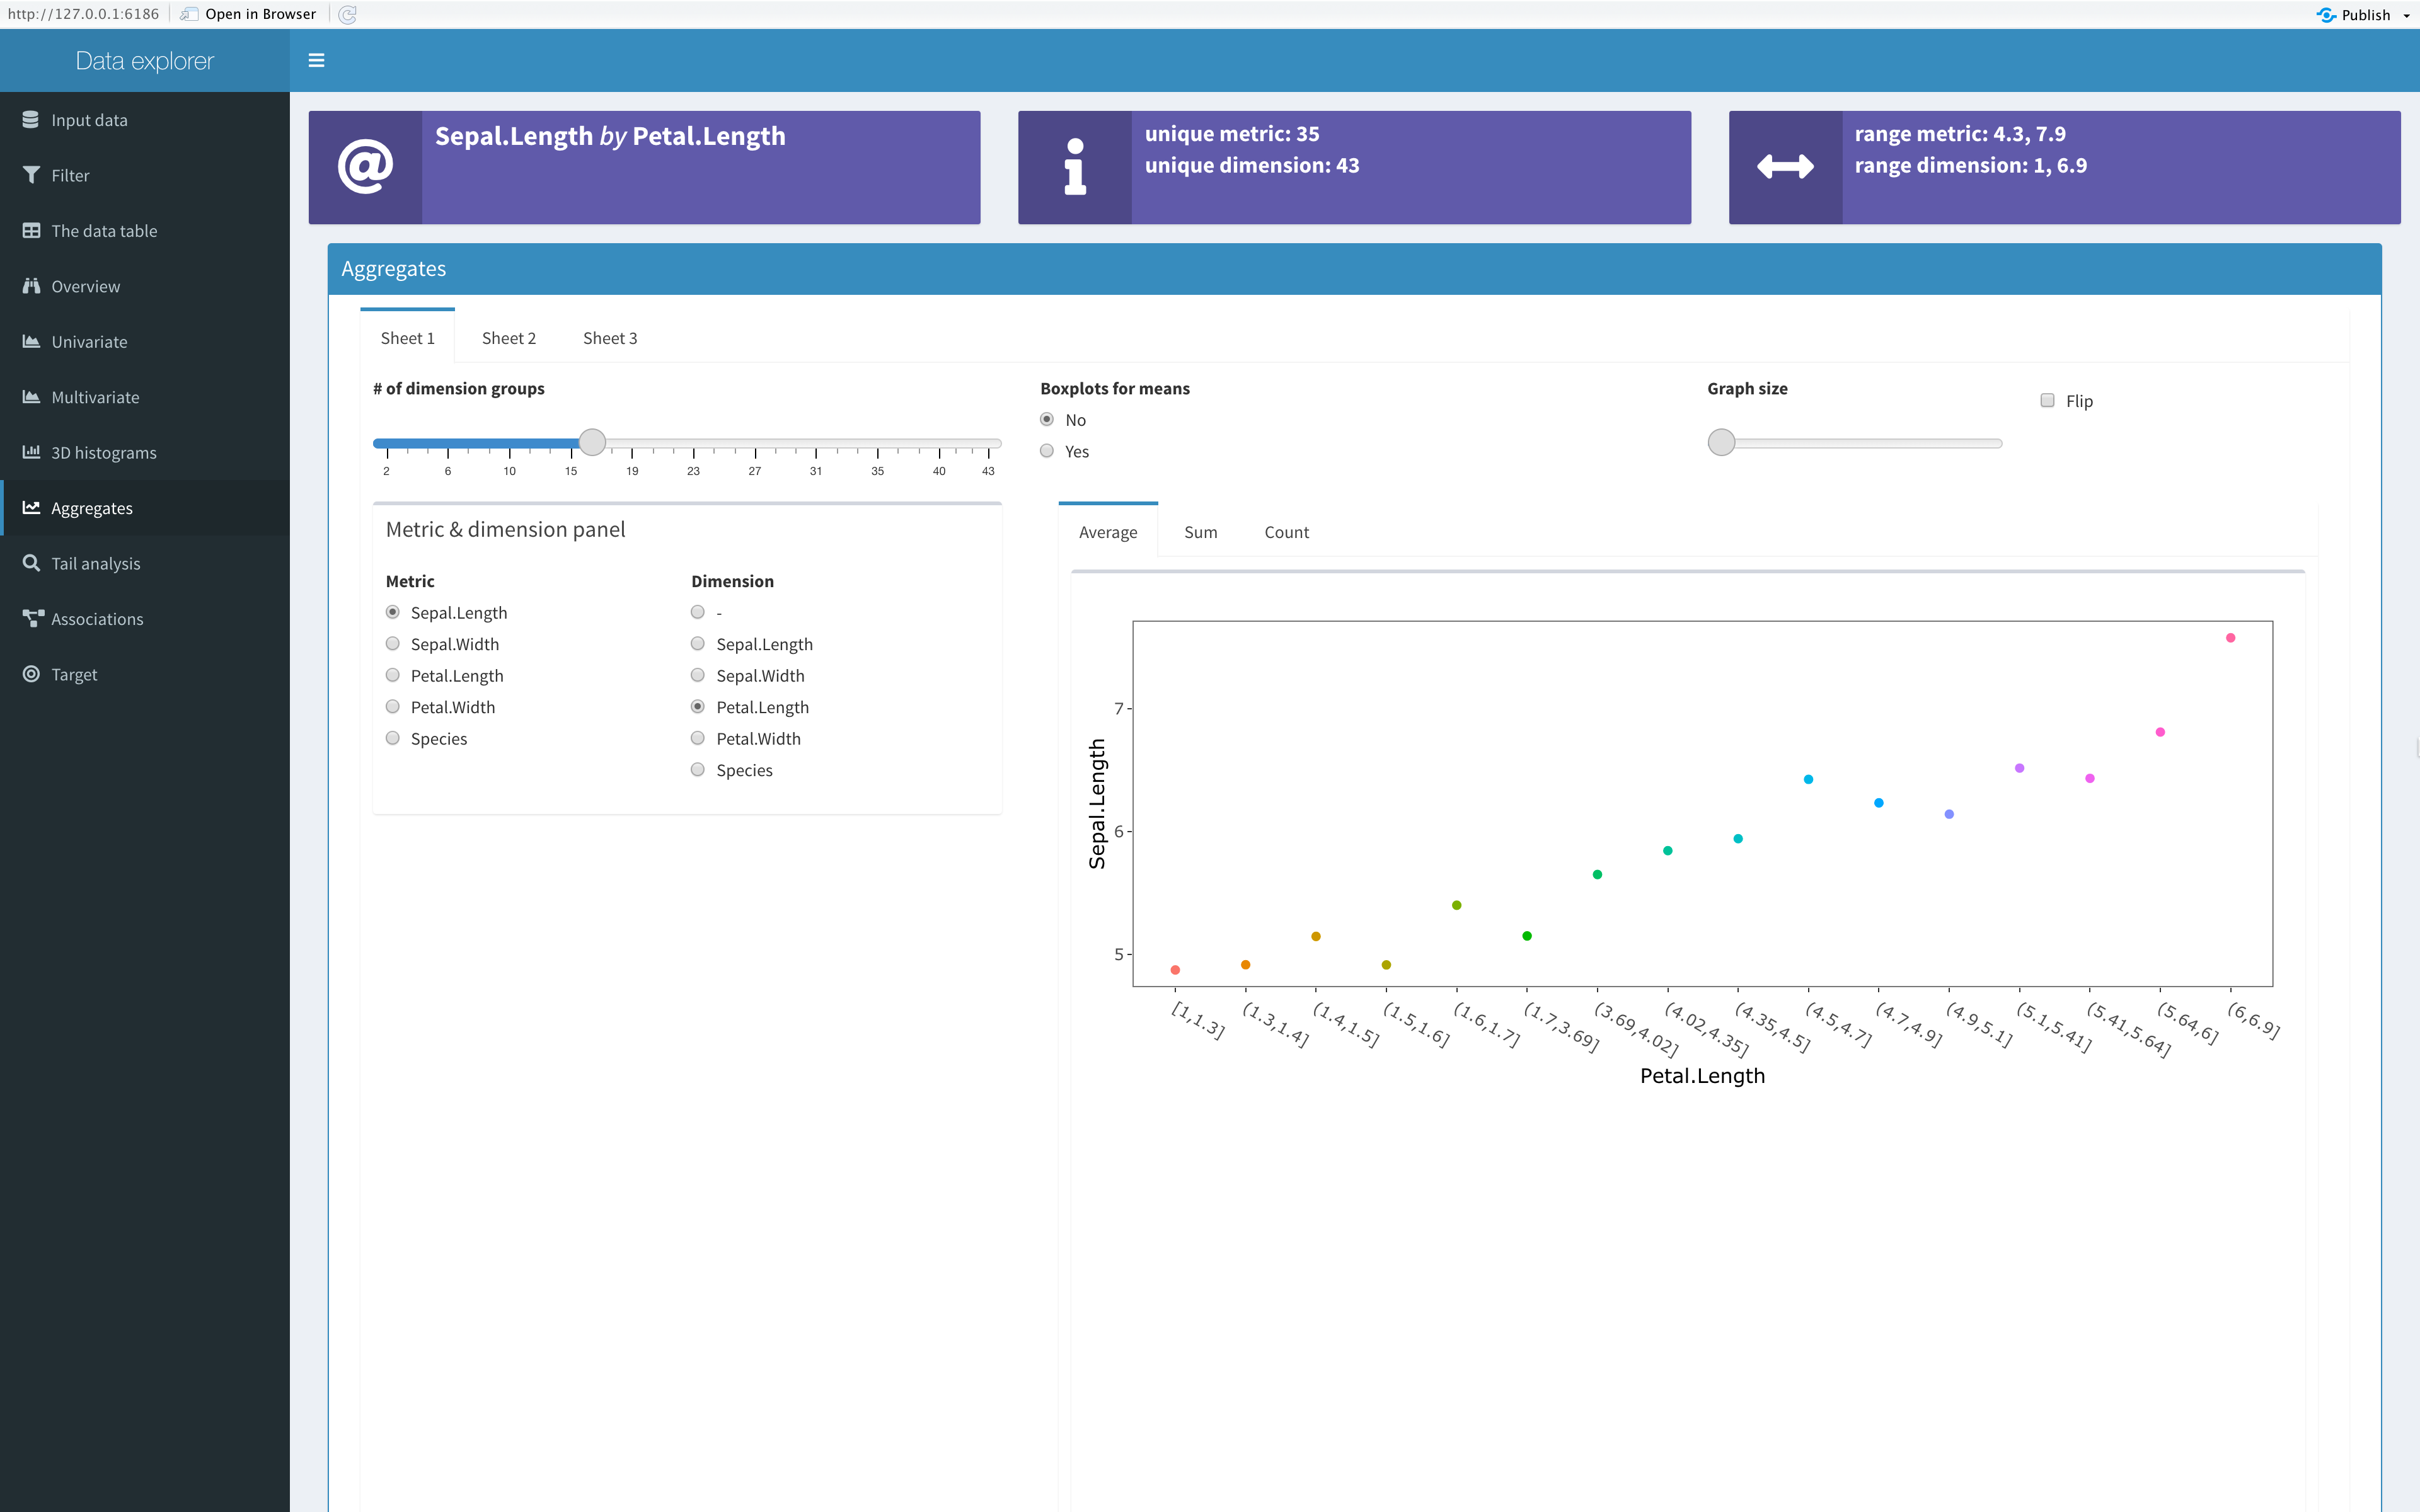
 Average sepal lengths for different petal lengths intervals (set by slider # of dimension groups)
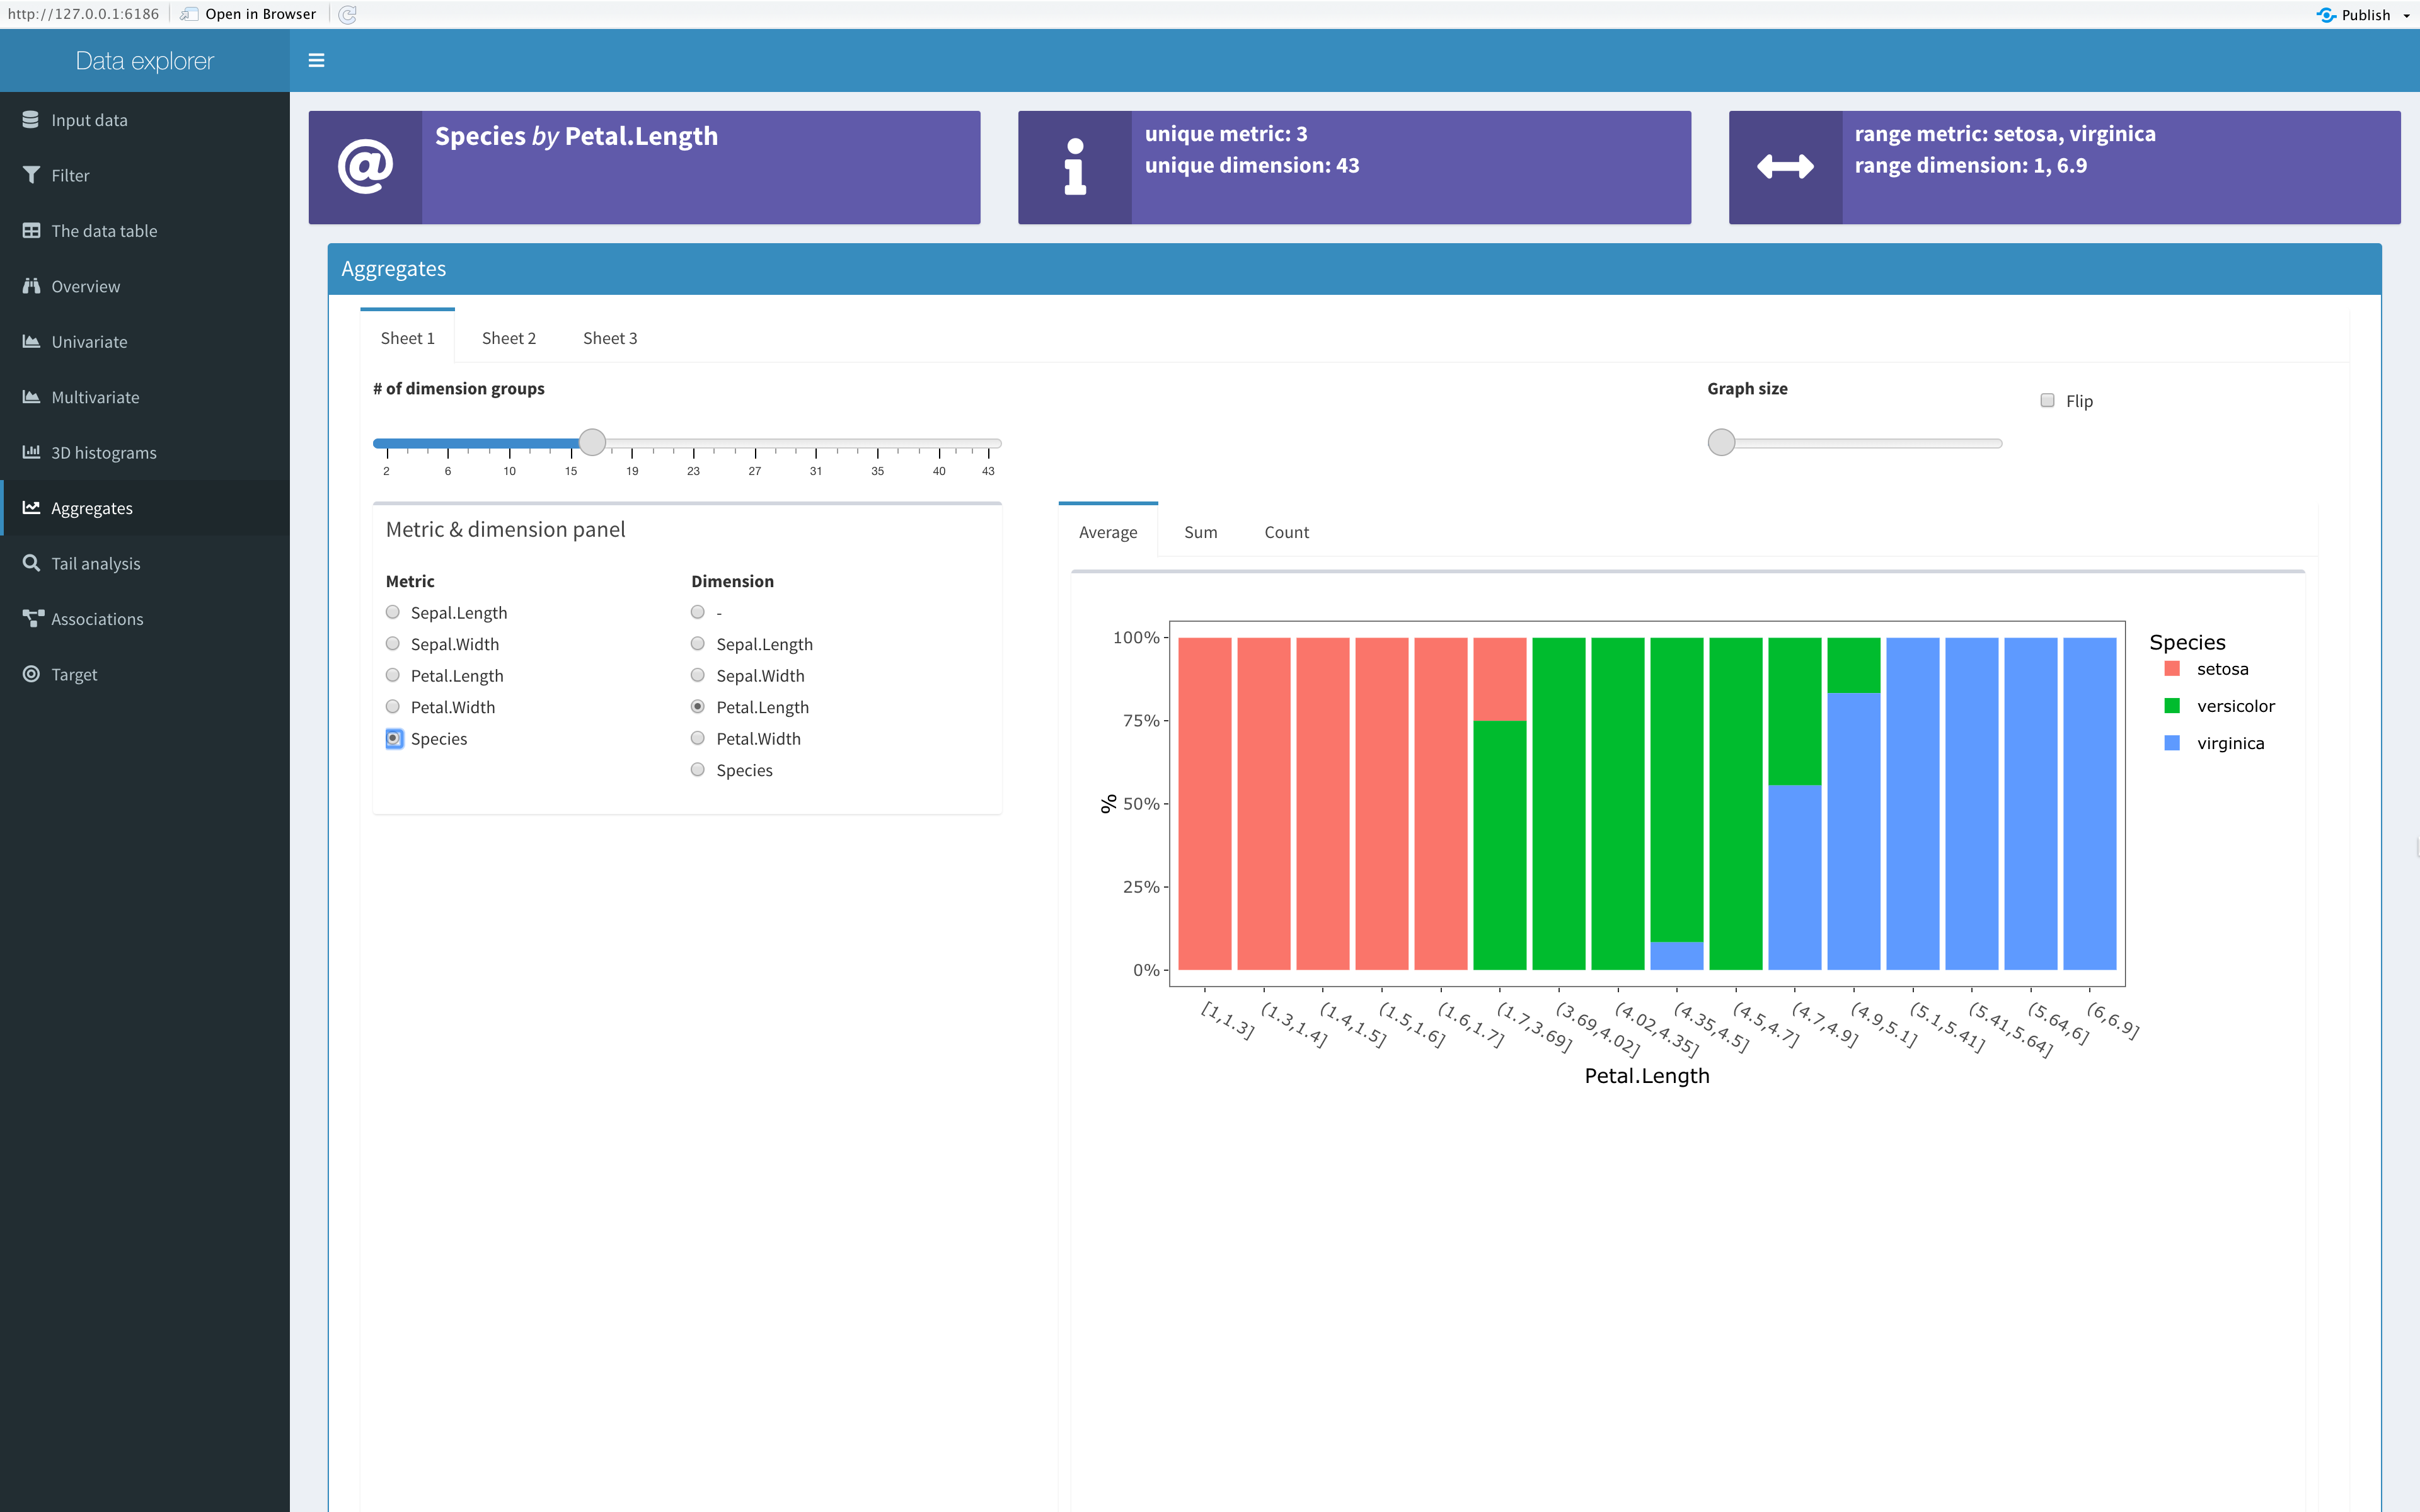
 Proportions of species for different petal lengths.