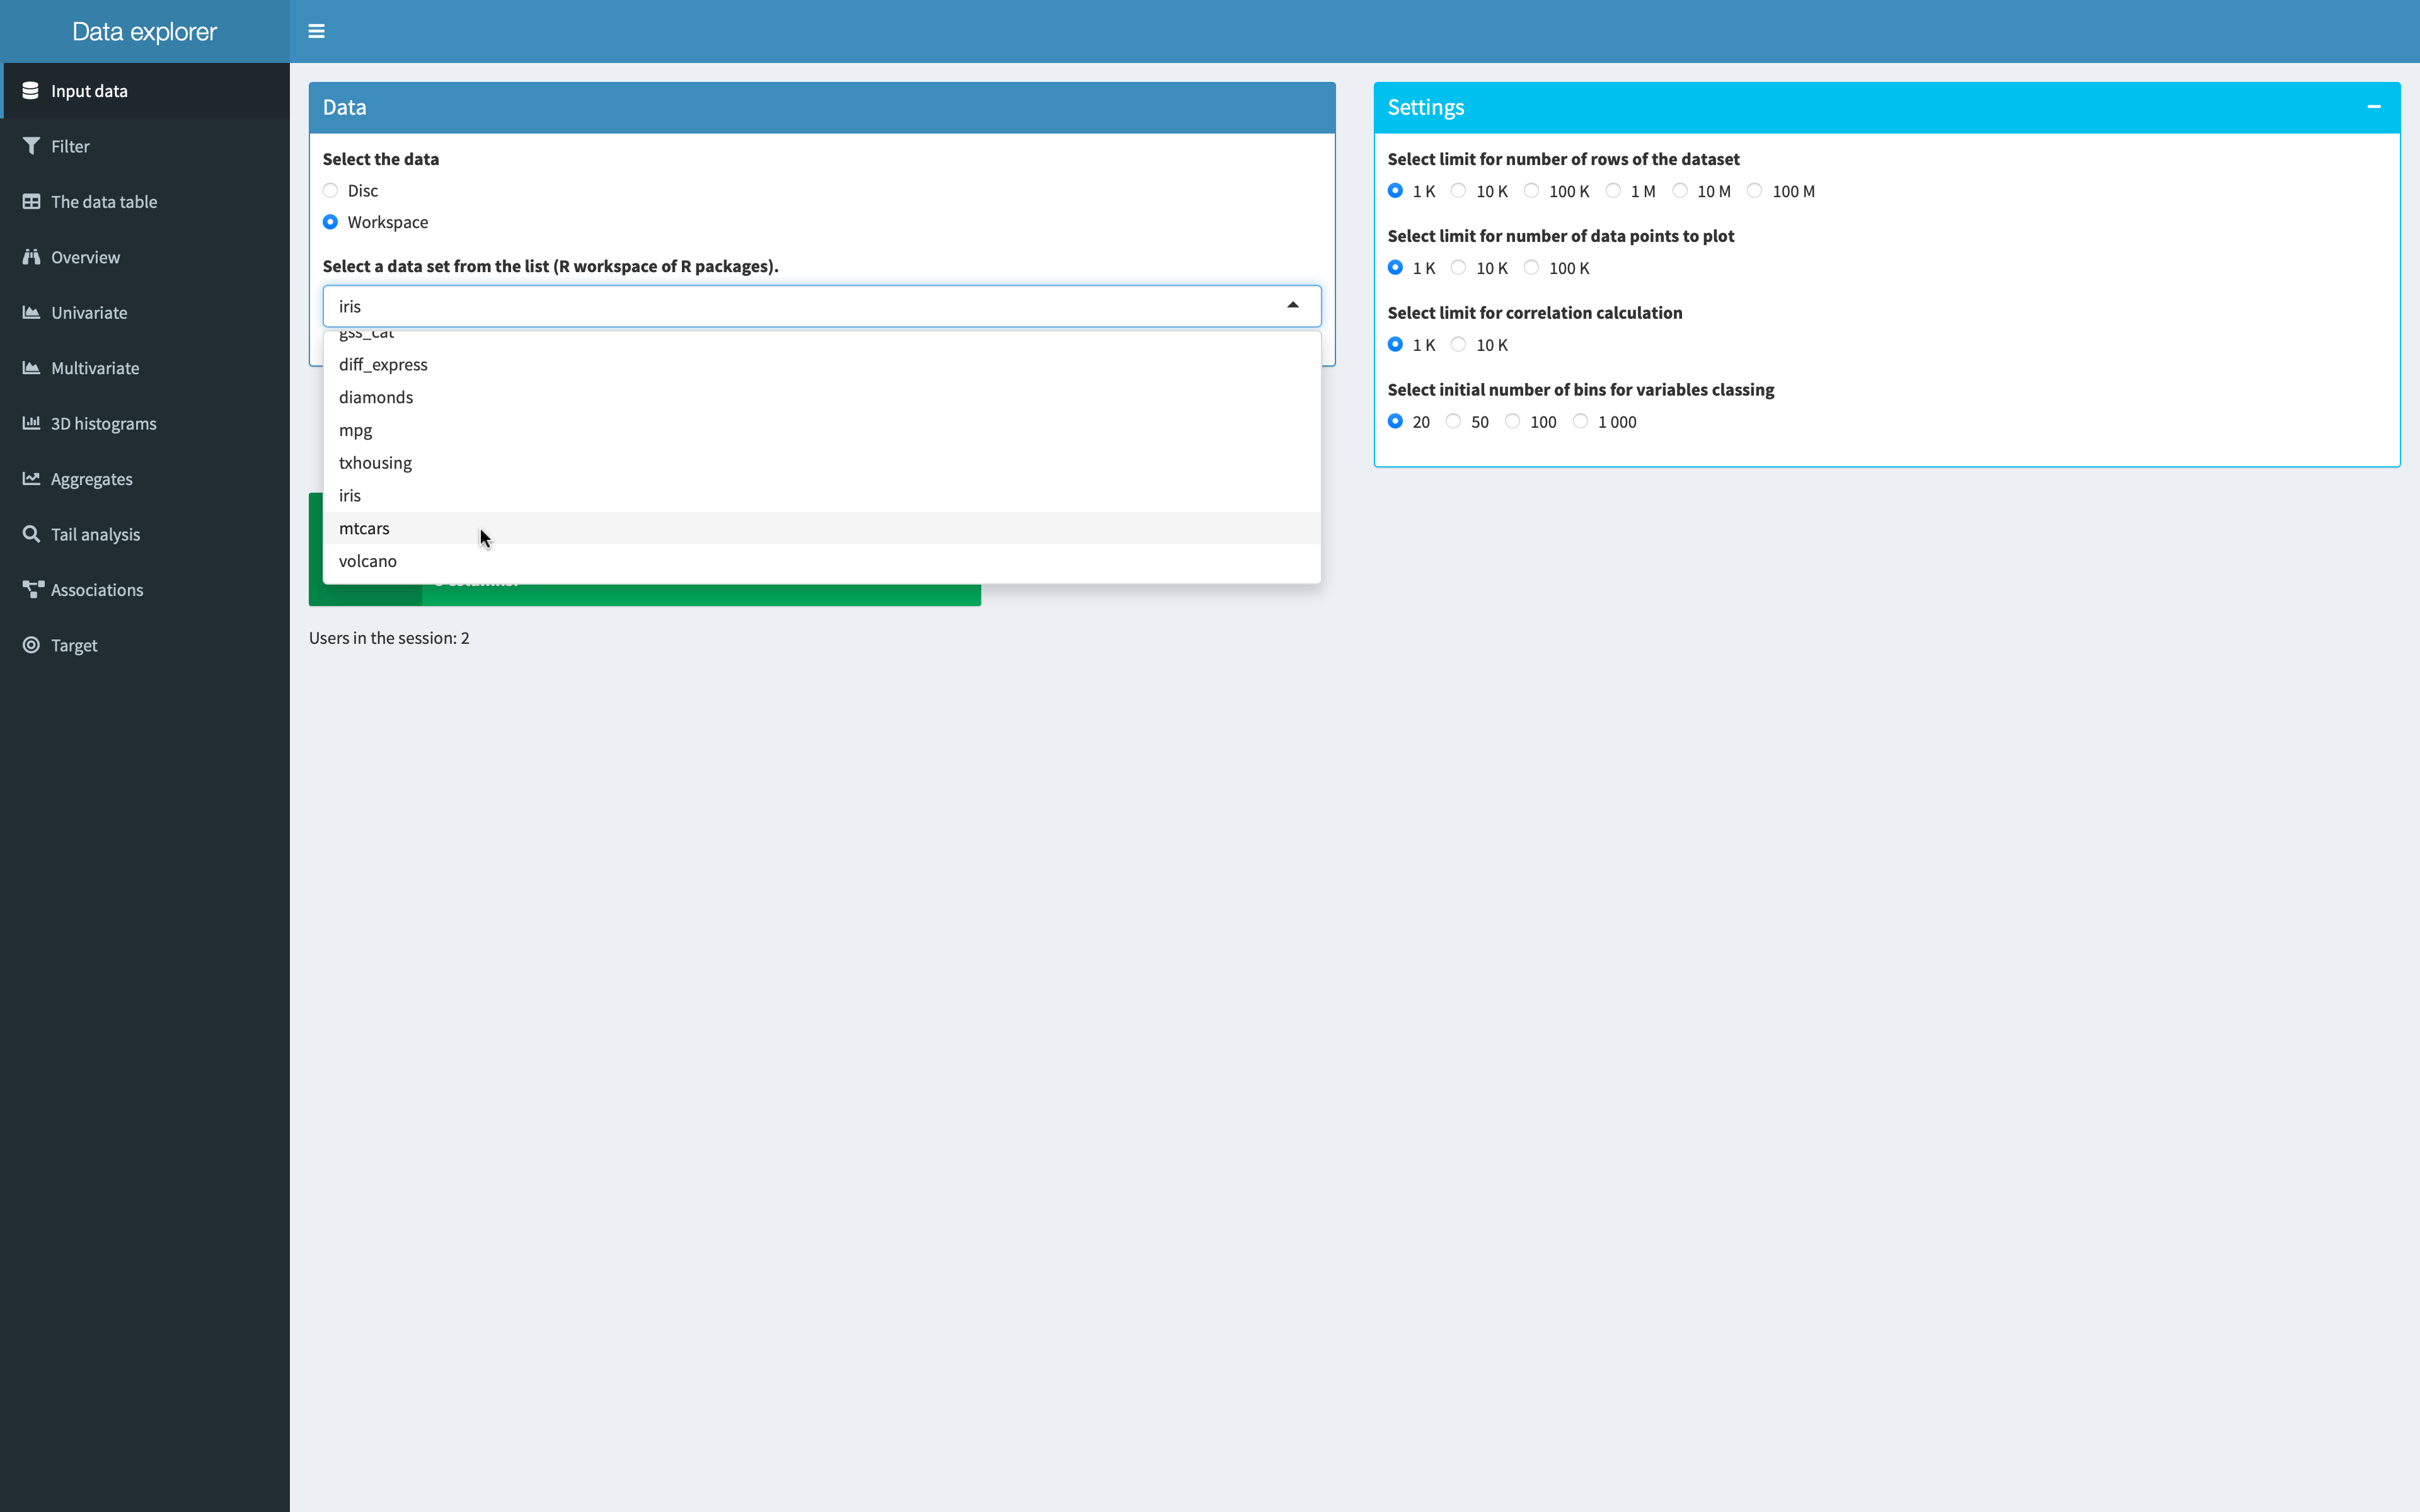
Select the data set.
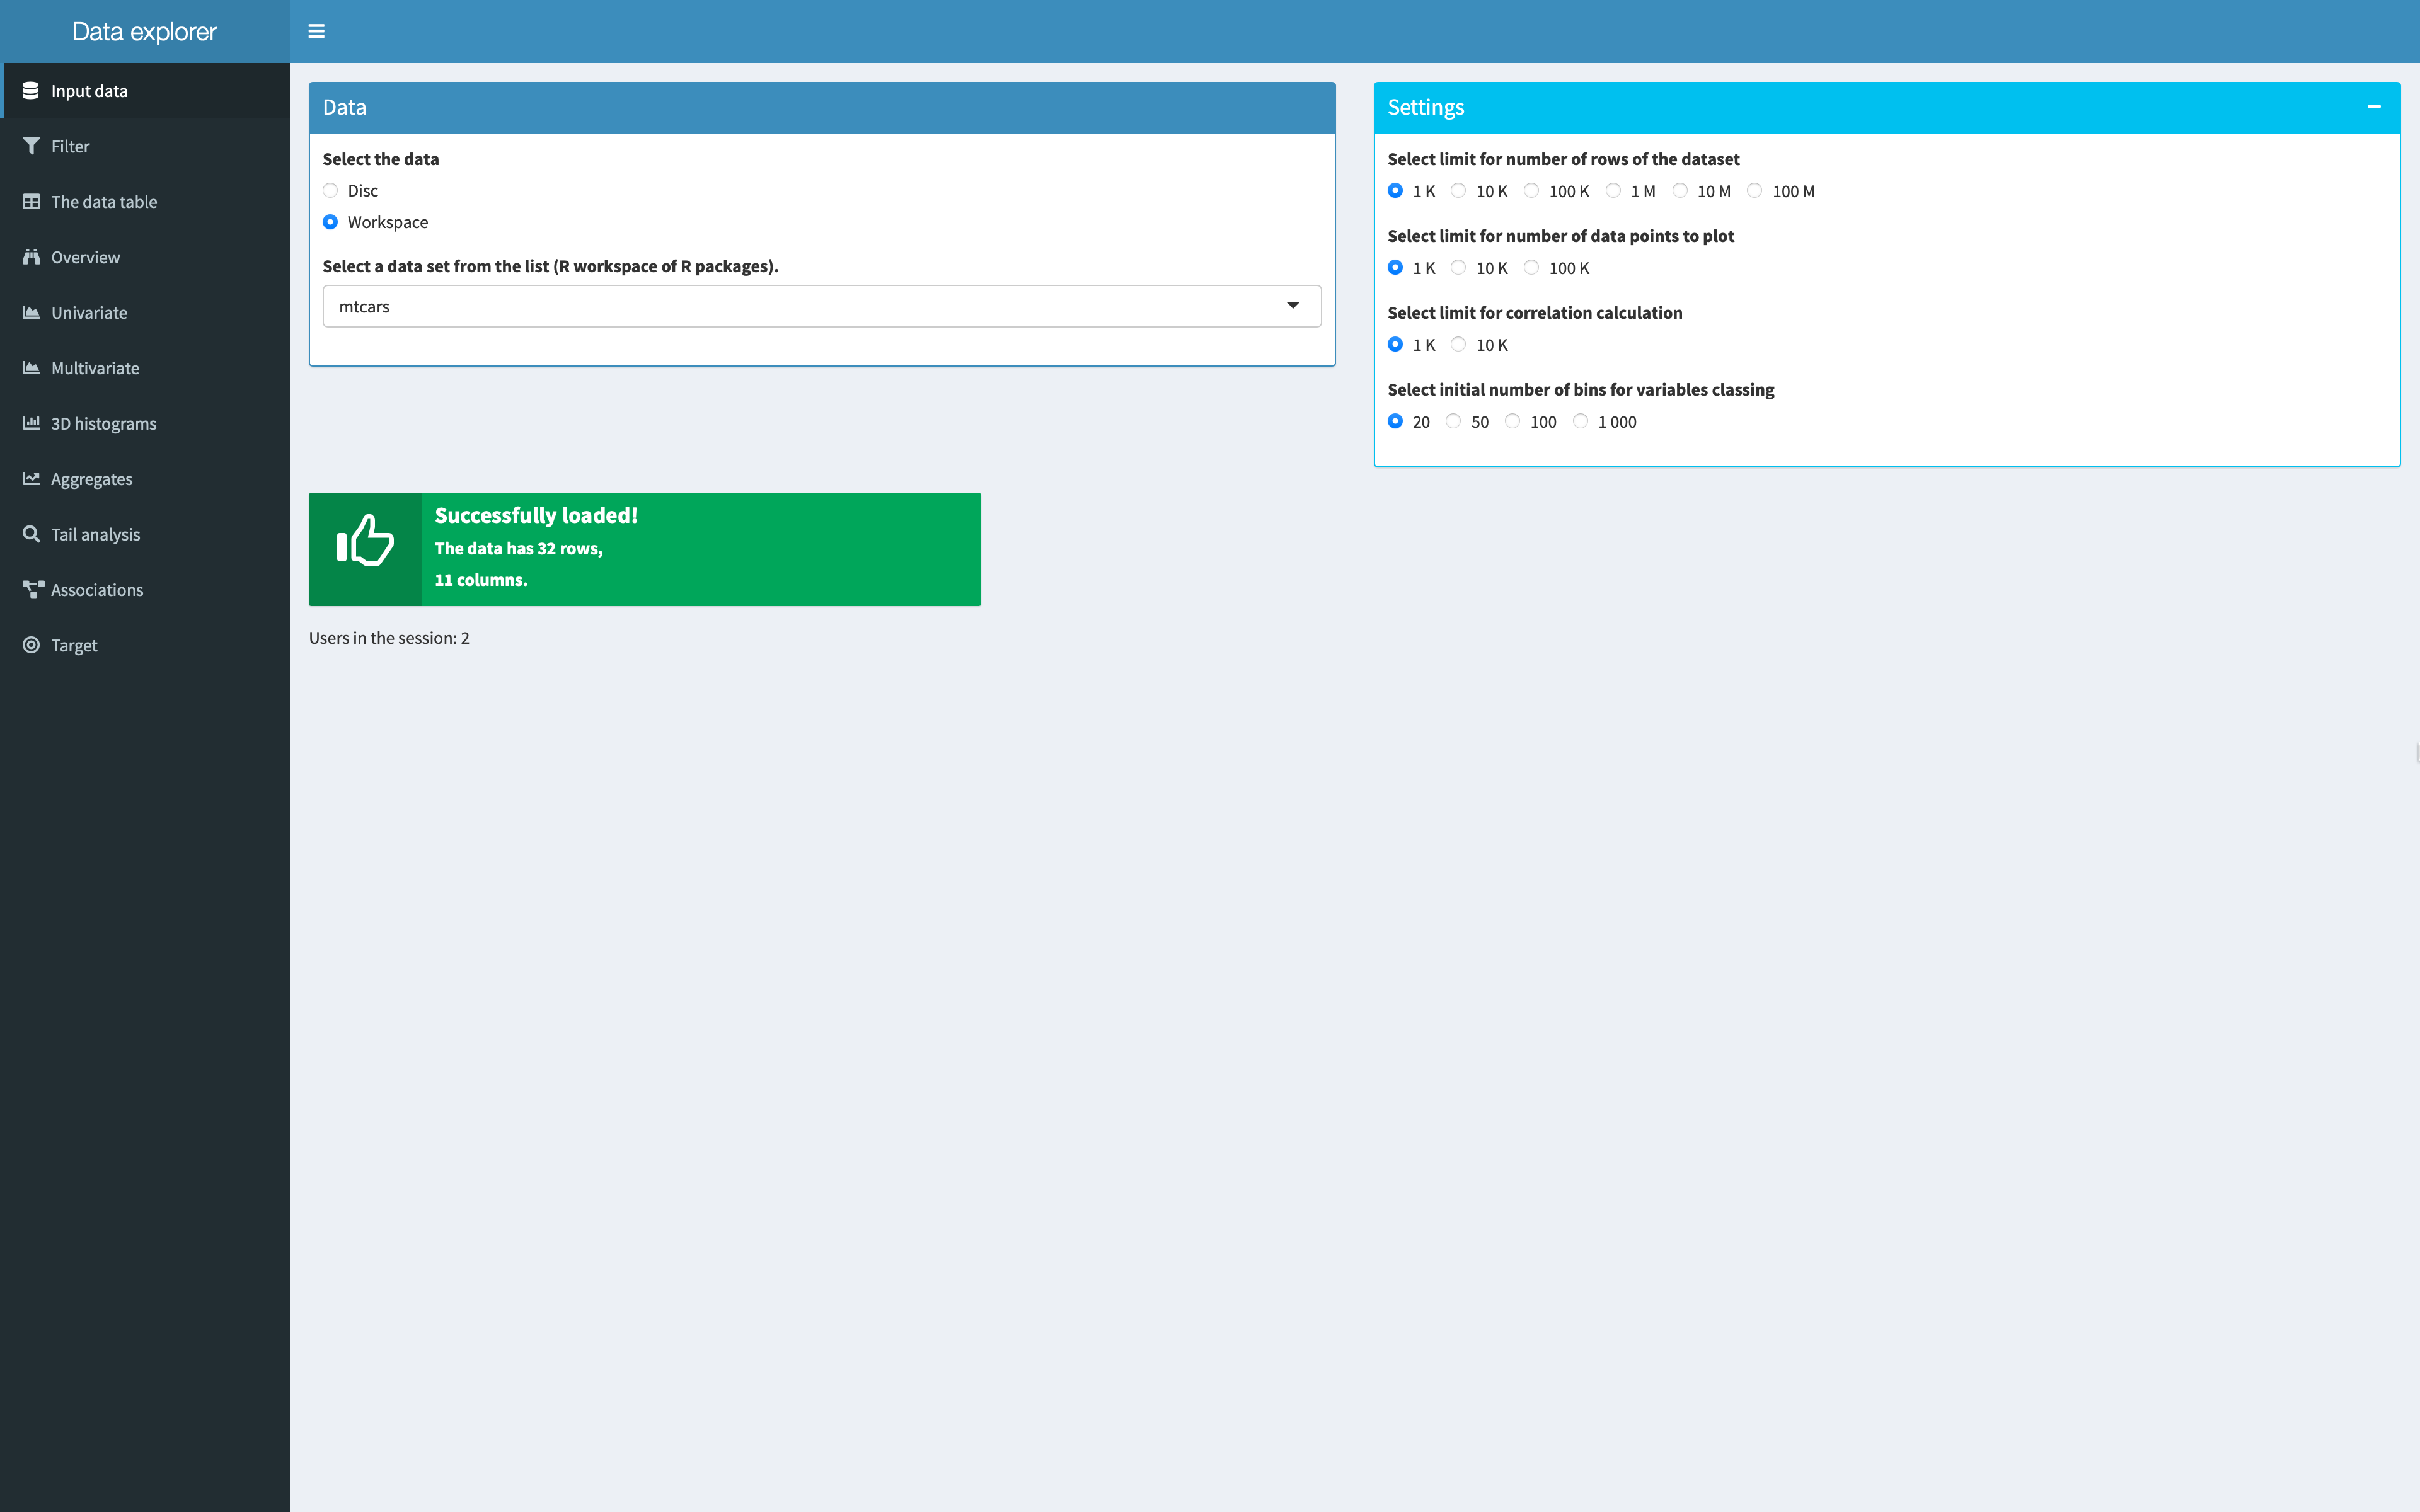
 When data is loaded, short info about number of rows and columns is showed.
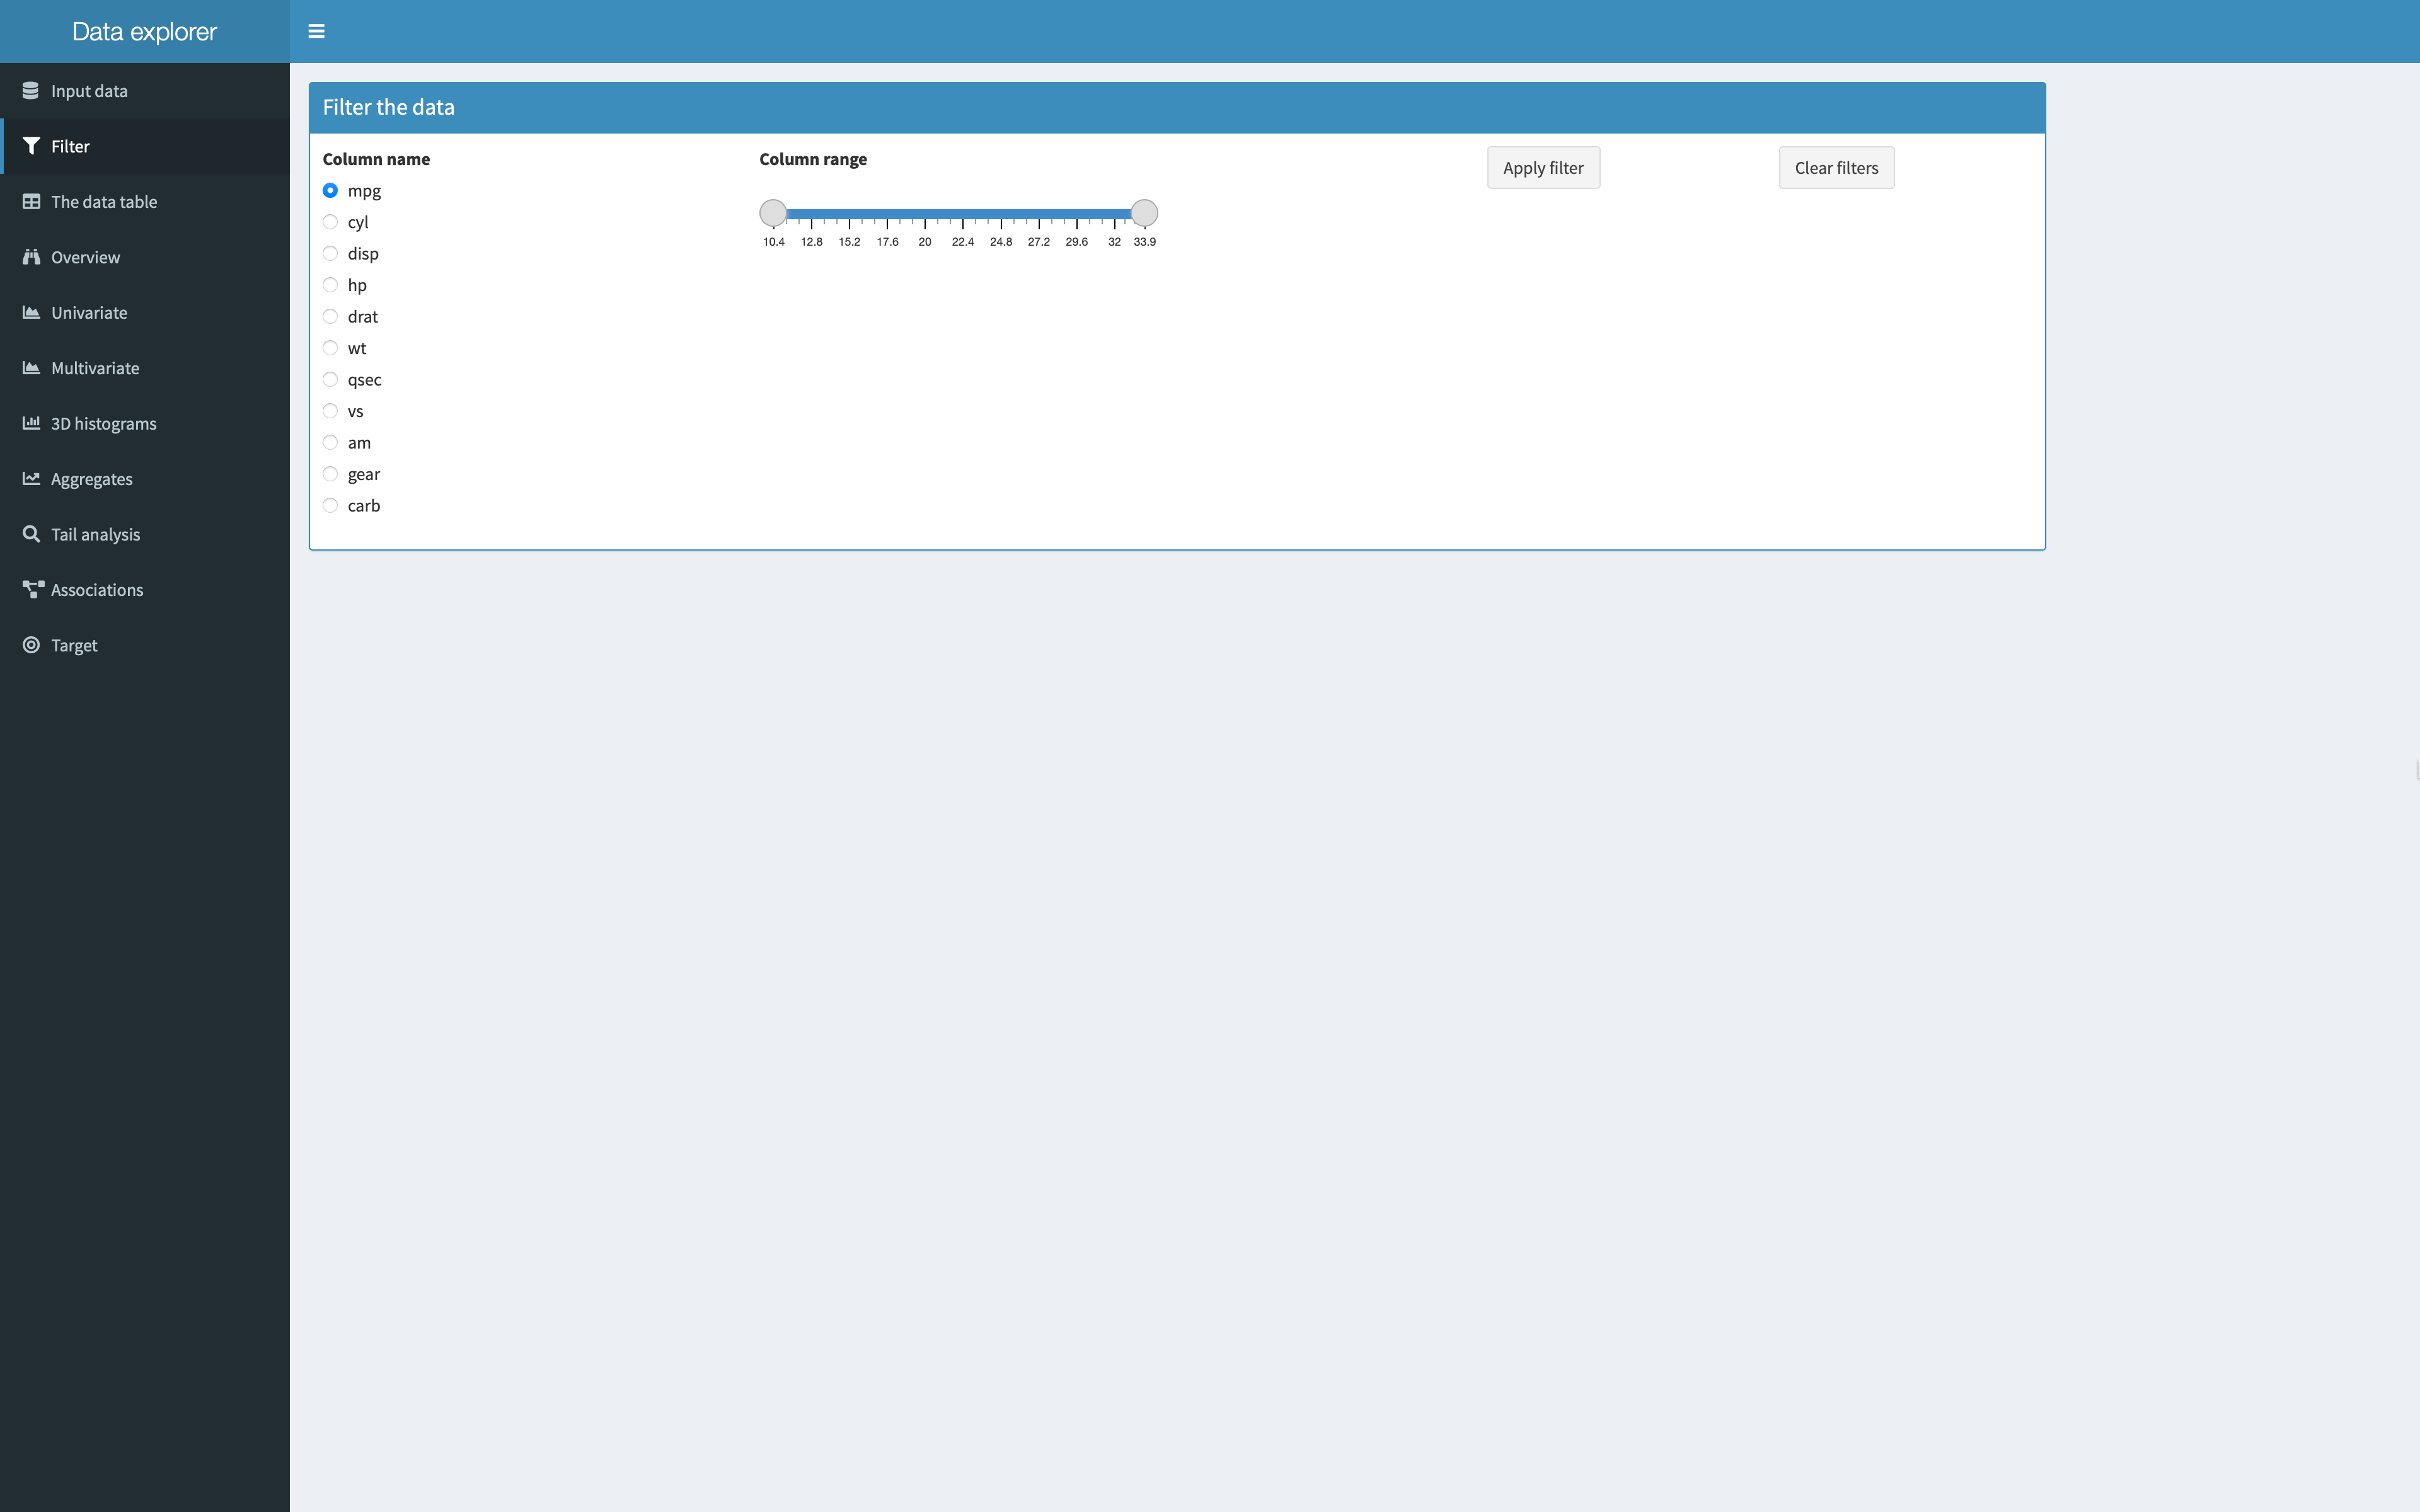
 Filter data if necessary. Here no filtration was applied.
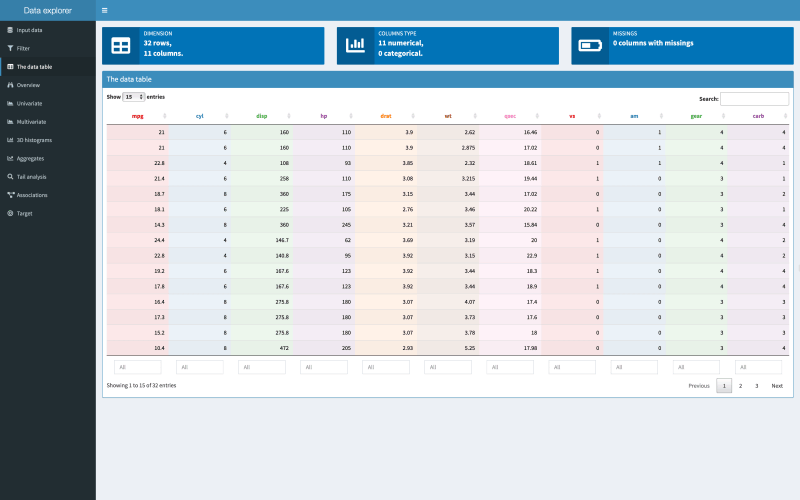 Data in table form presented.
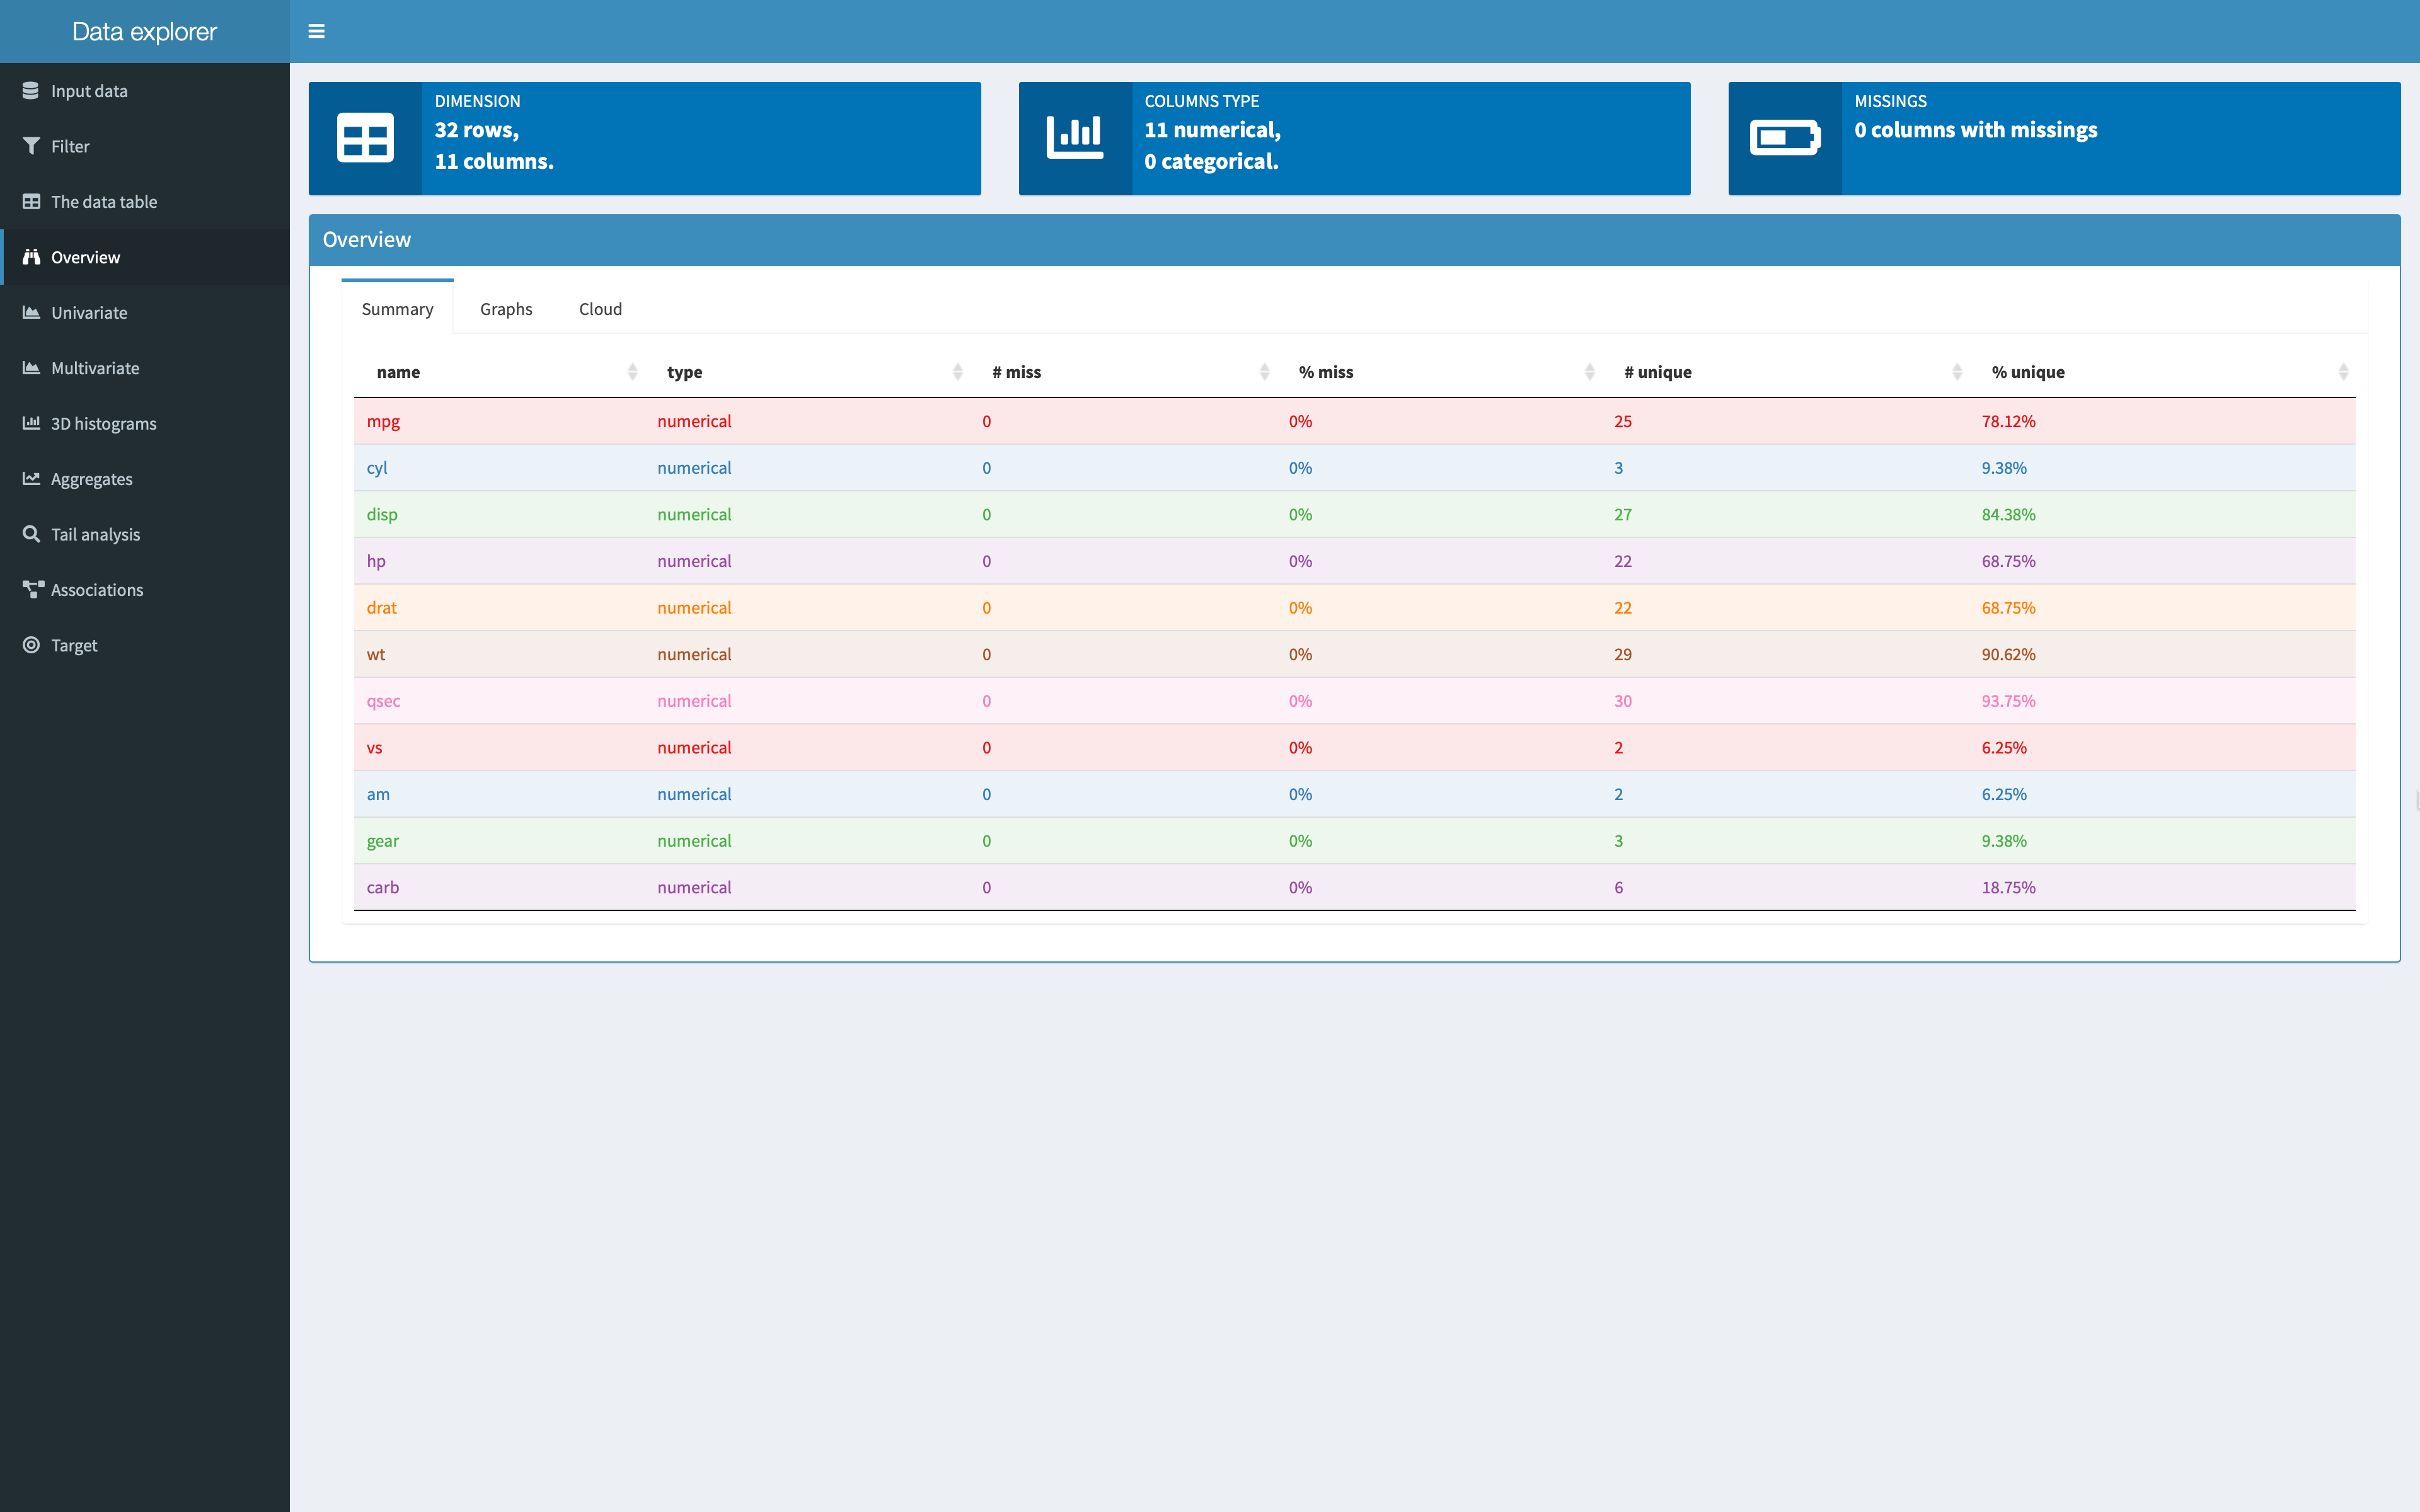
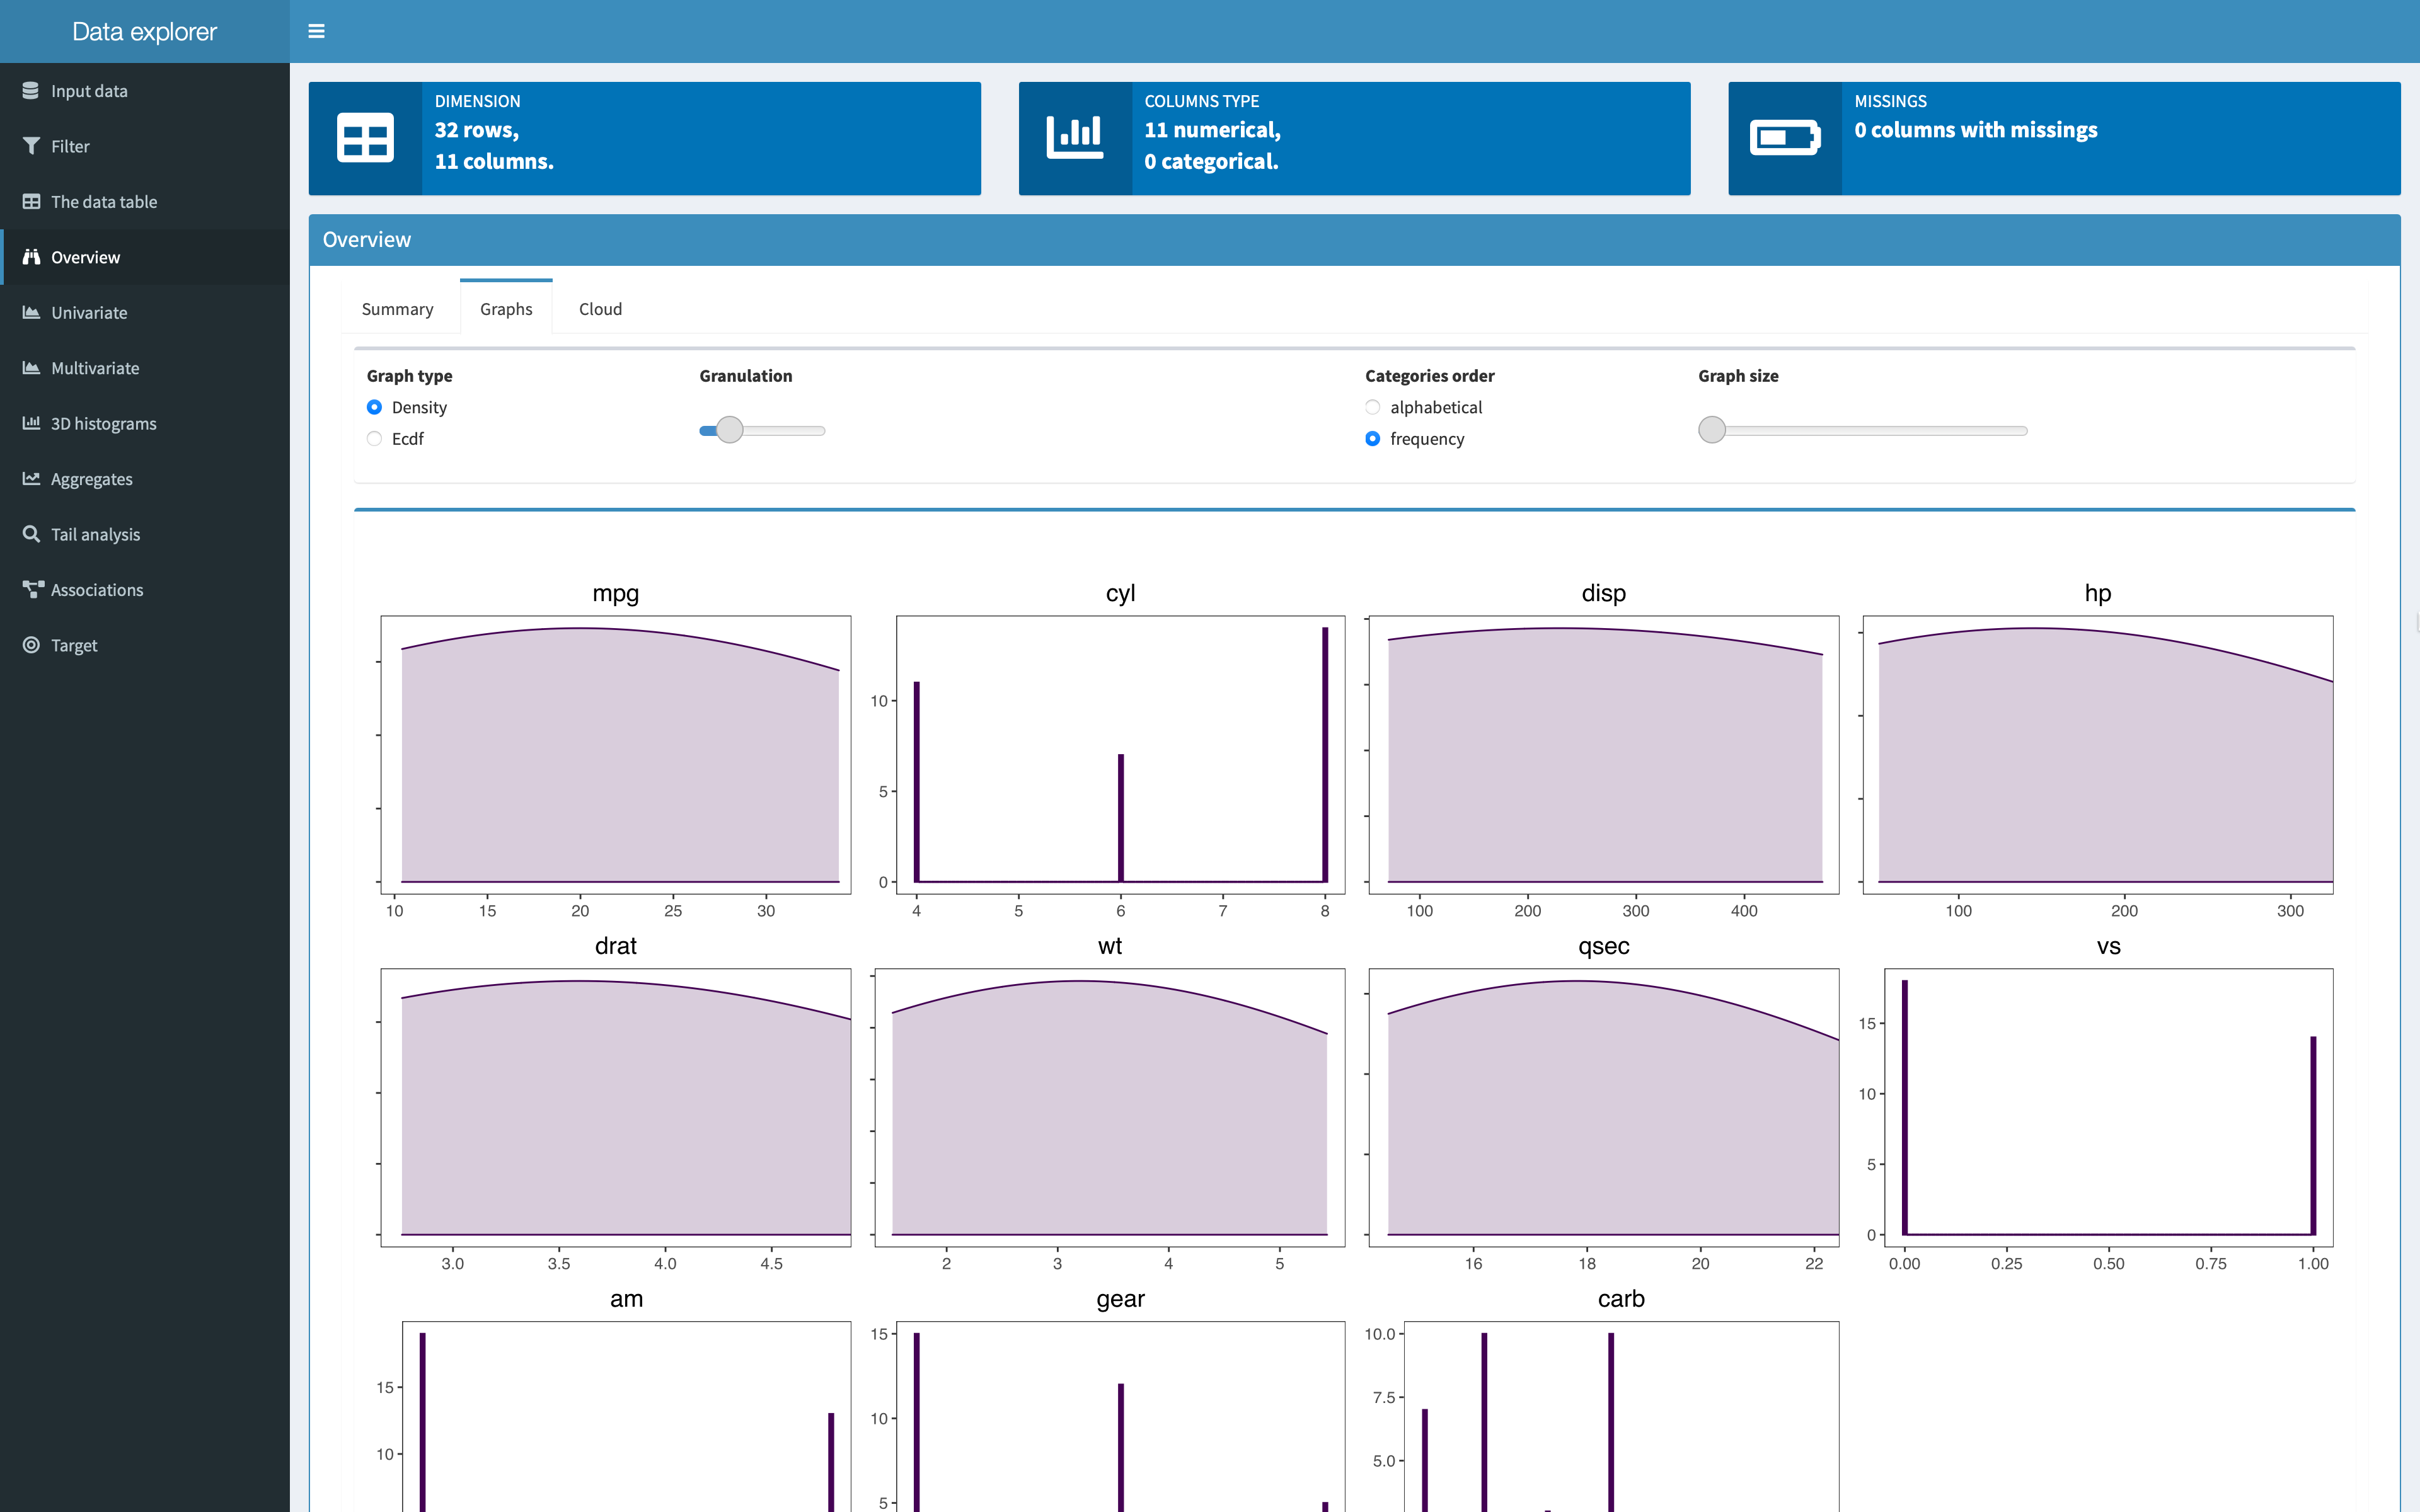
 Overview summary info about columns: names, types, missings, uniques.
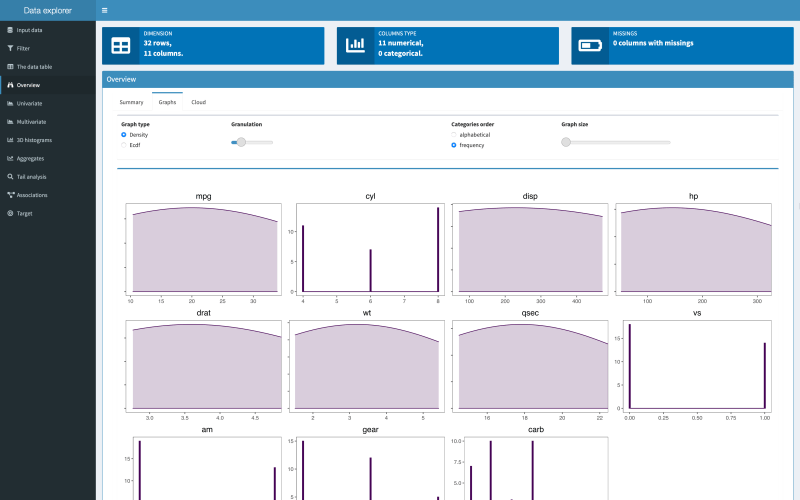 Densities of all the columns.
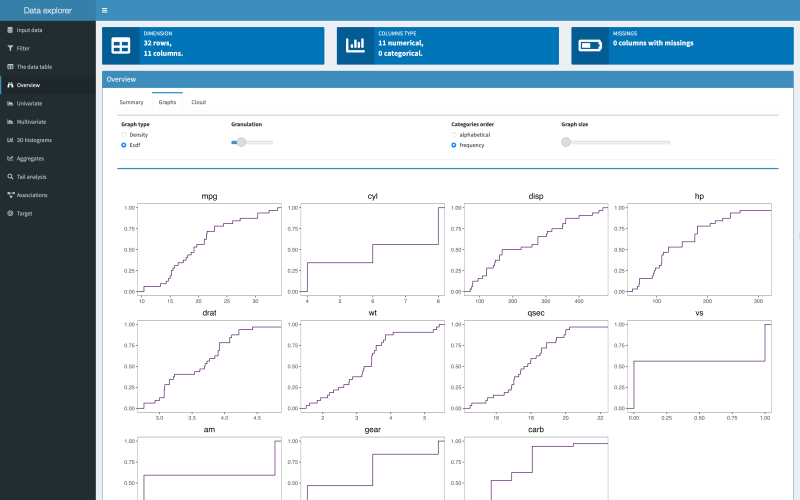 Empirical cumulative distribution functions for all the columns.
 Clouds.
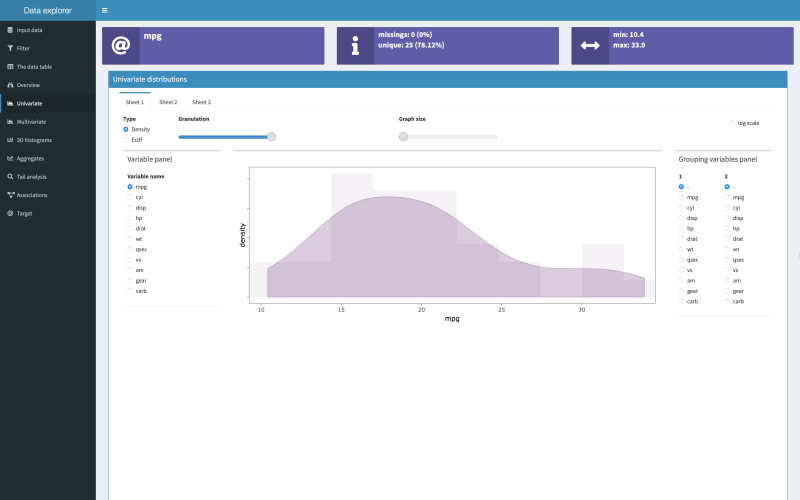 Univariate density (histogram) of miles per galon.
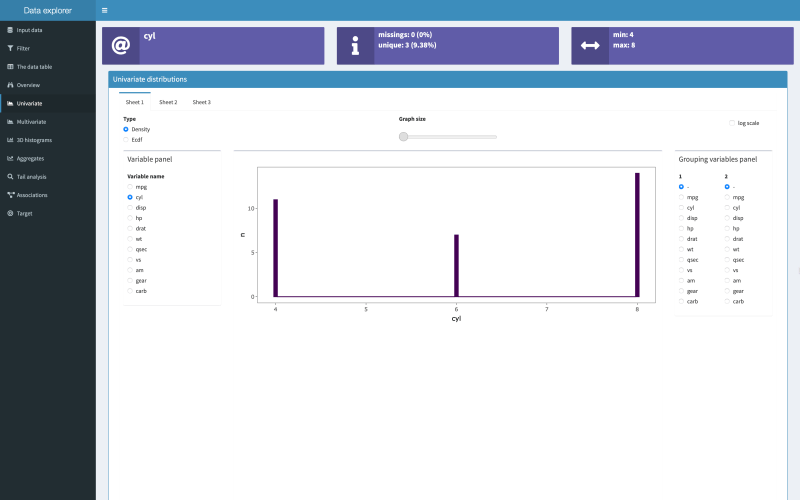 Univariate density (histogram) of number of cylinders.
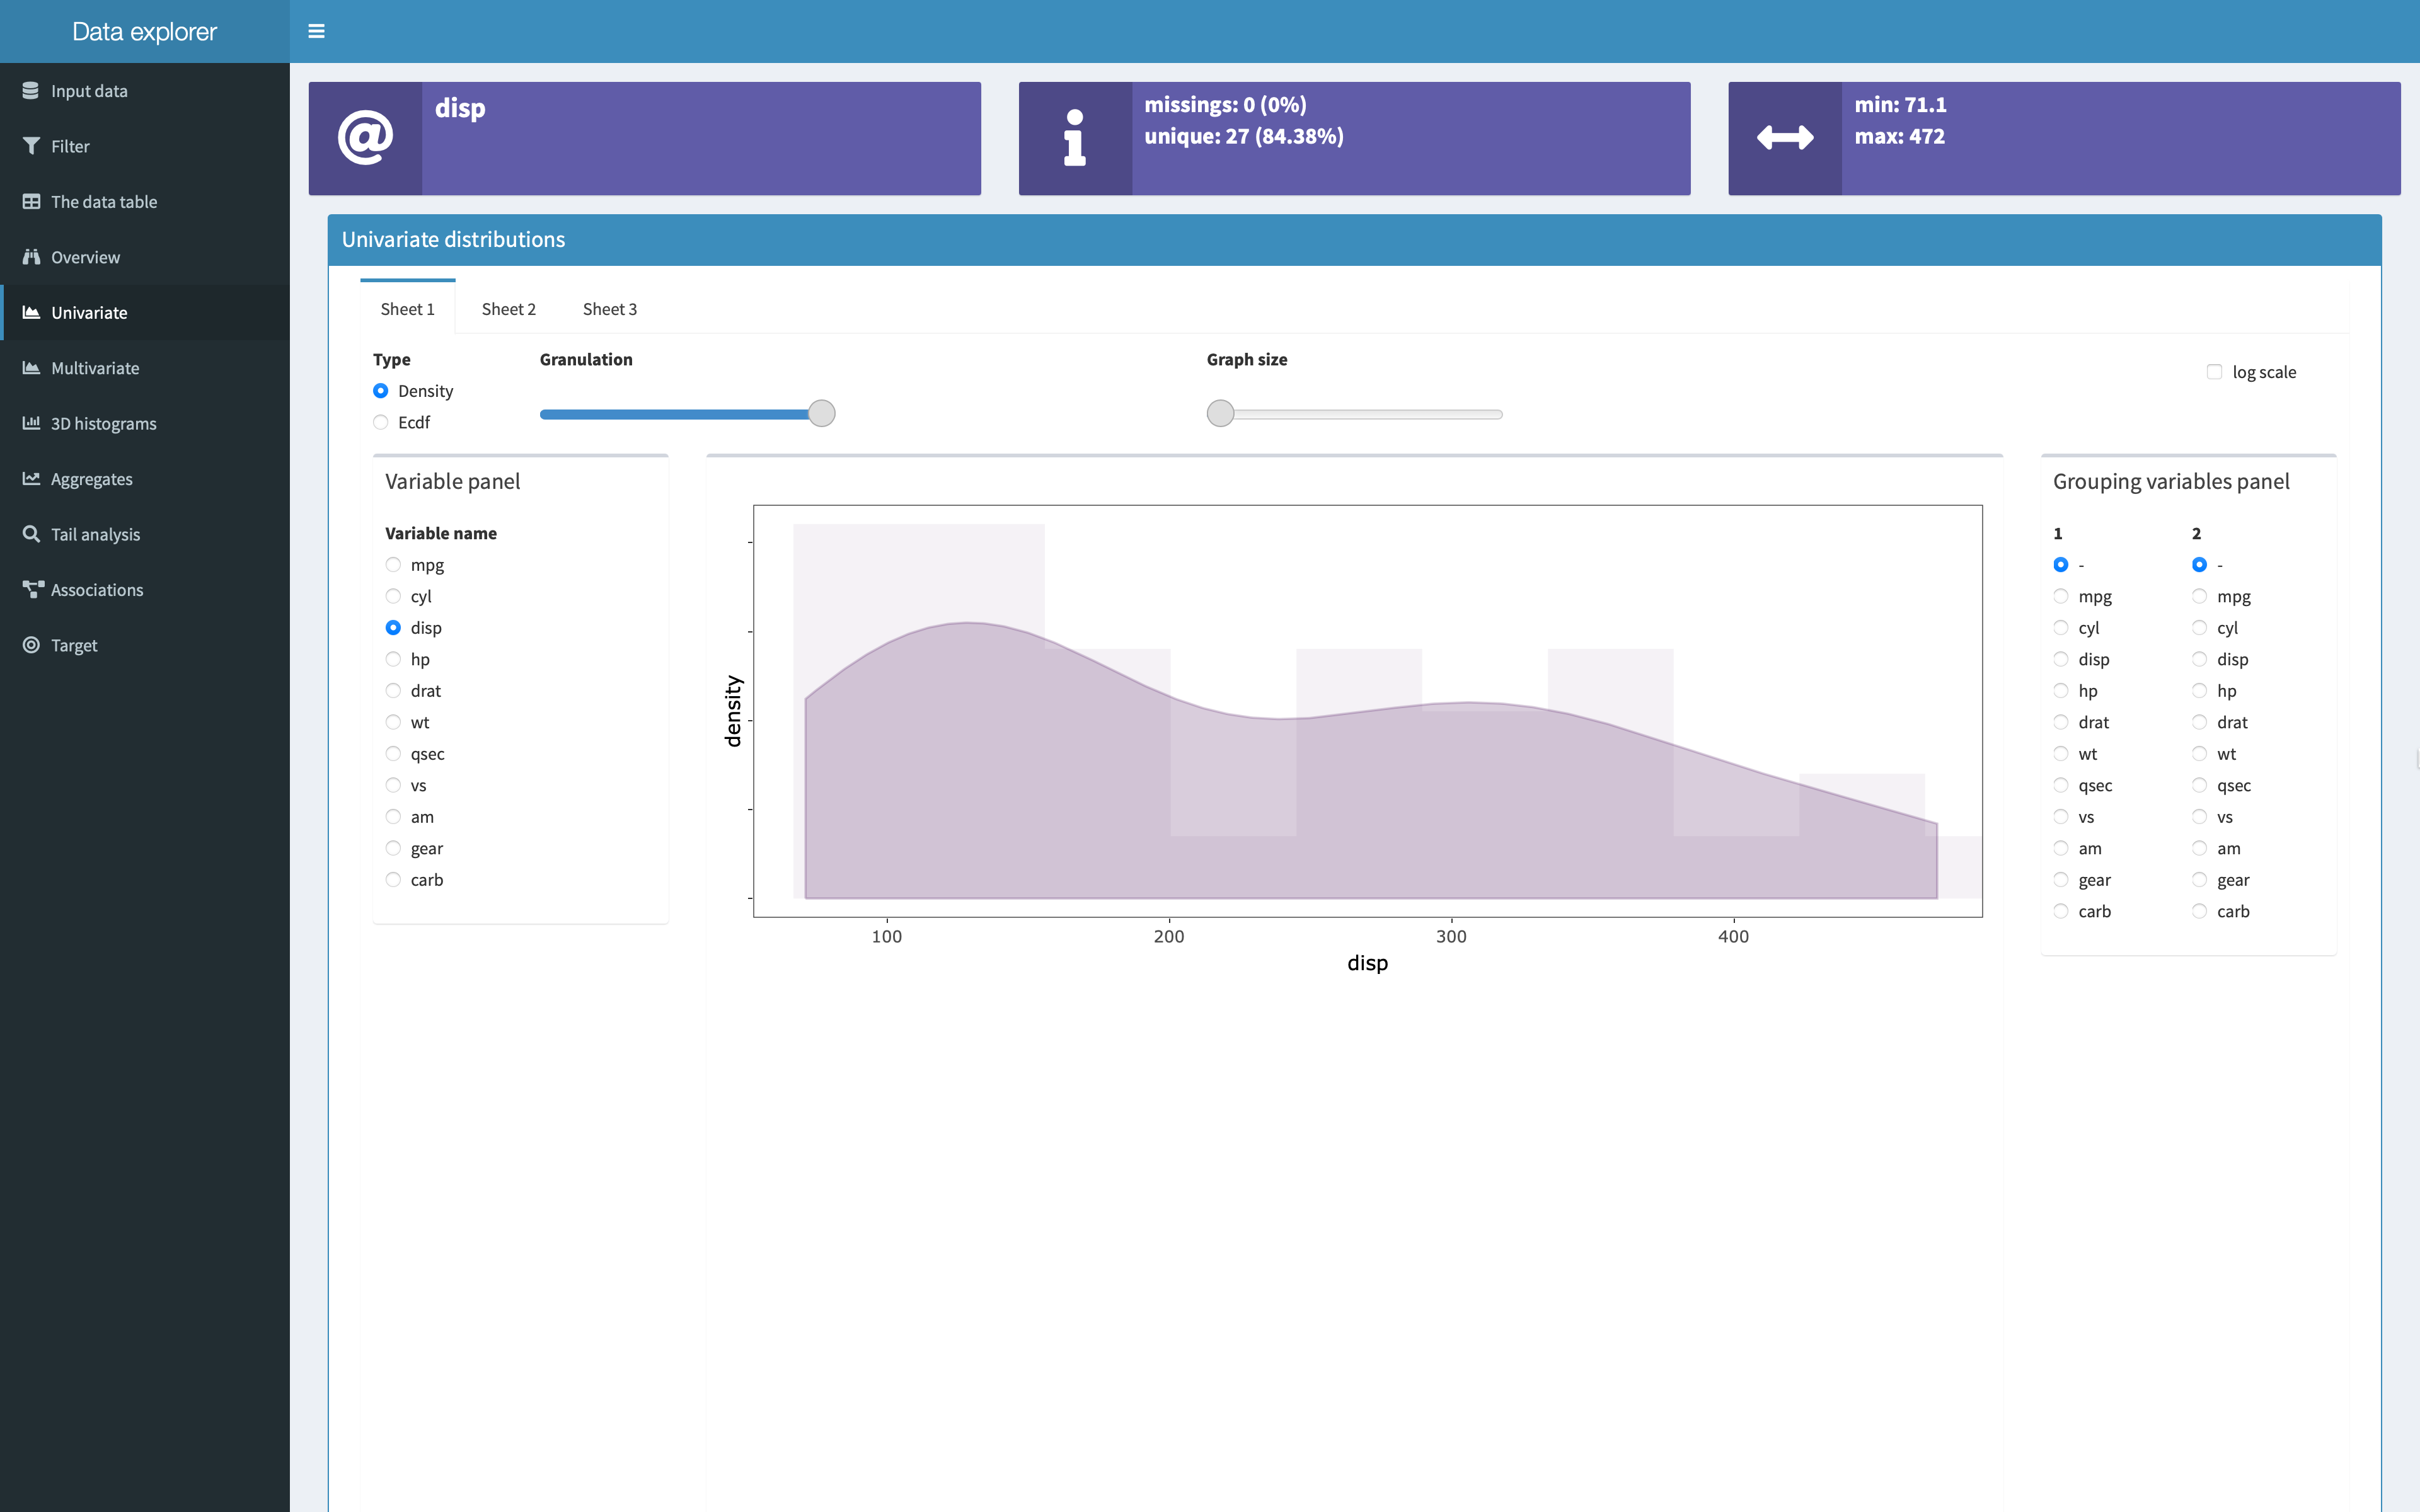
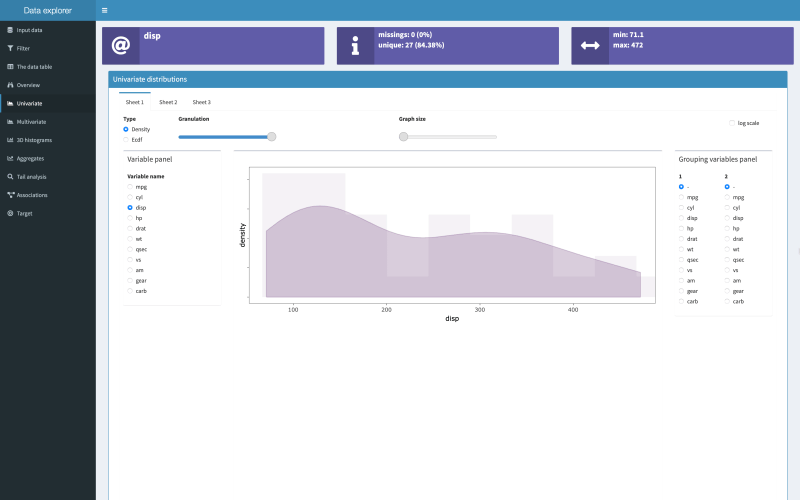 Univariate density (histogram) of displacement.
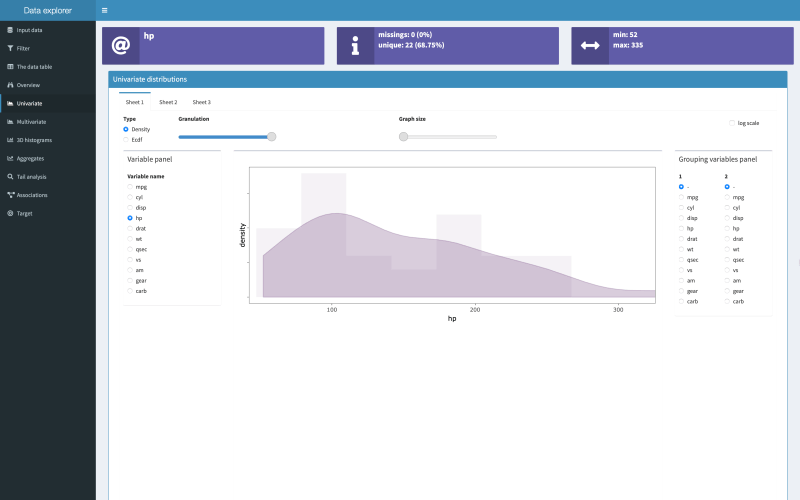 Univariate density (histogram) of gross horsepower.
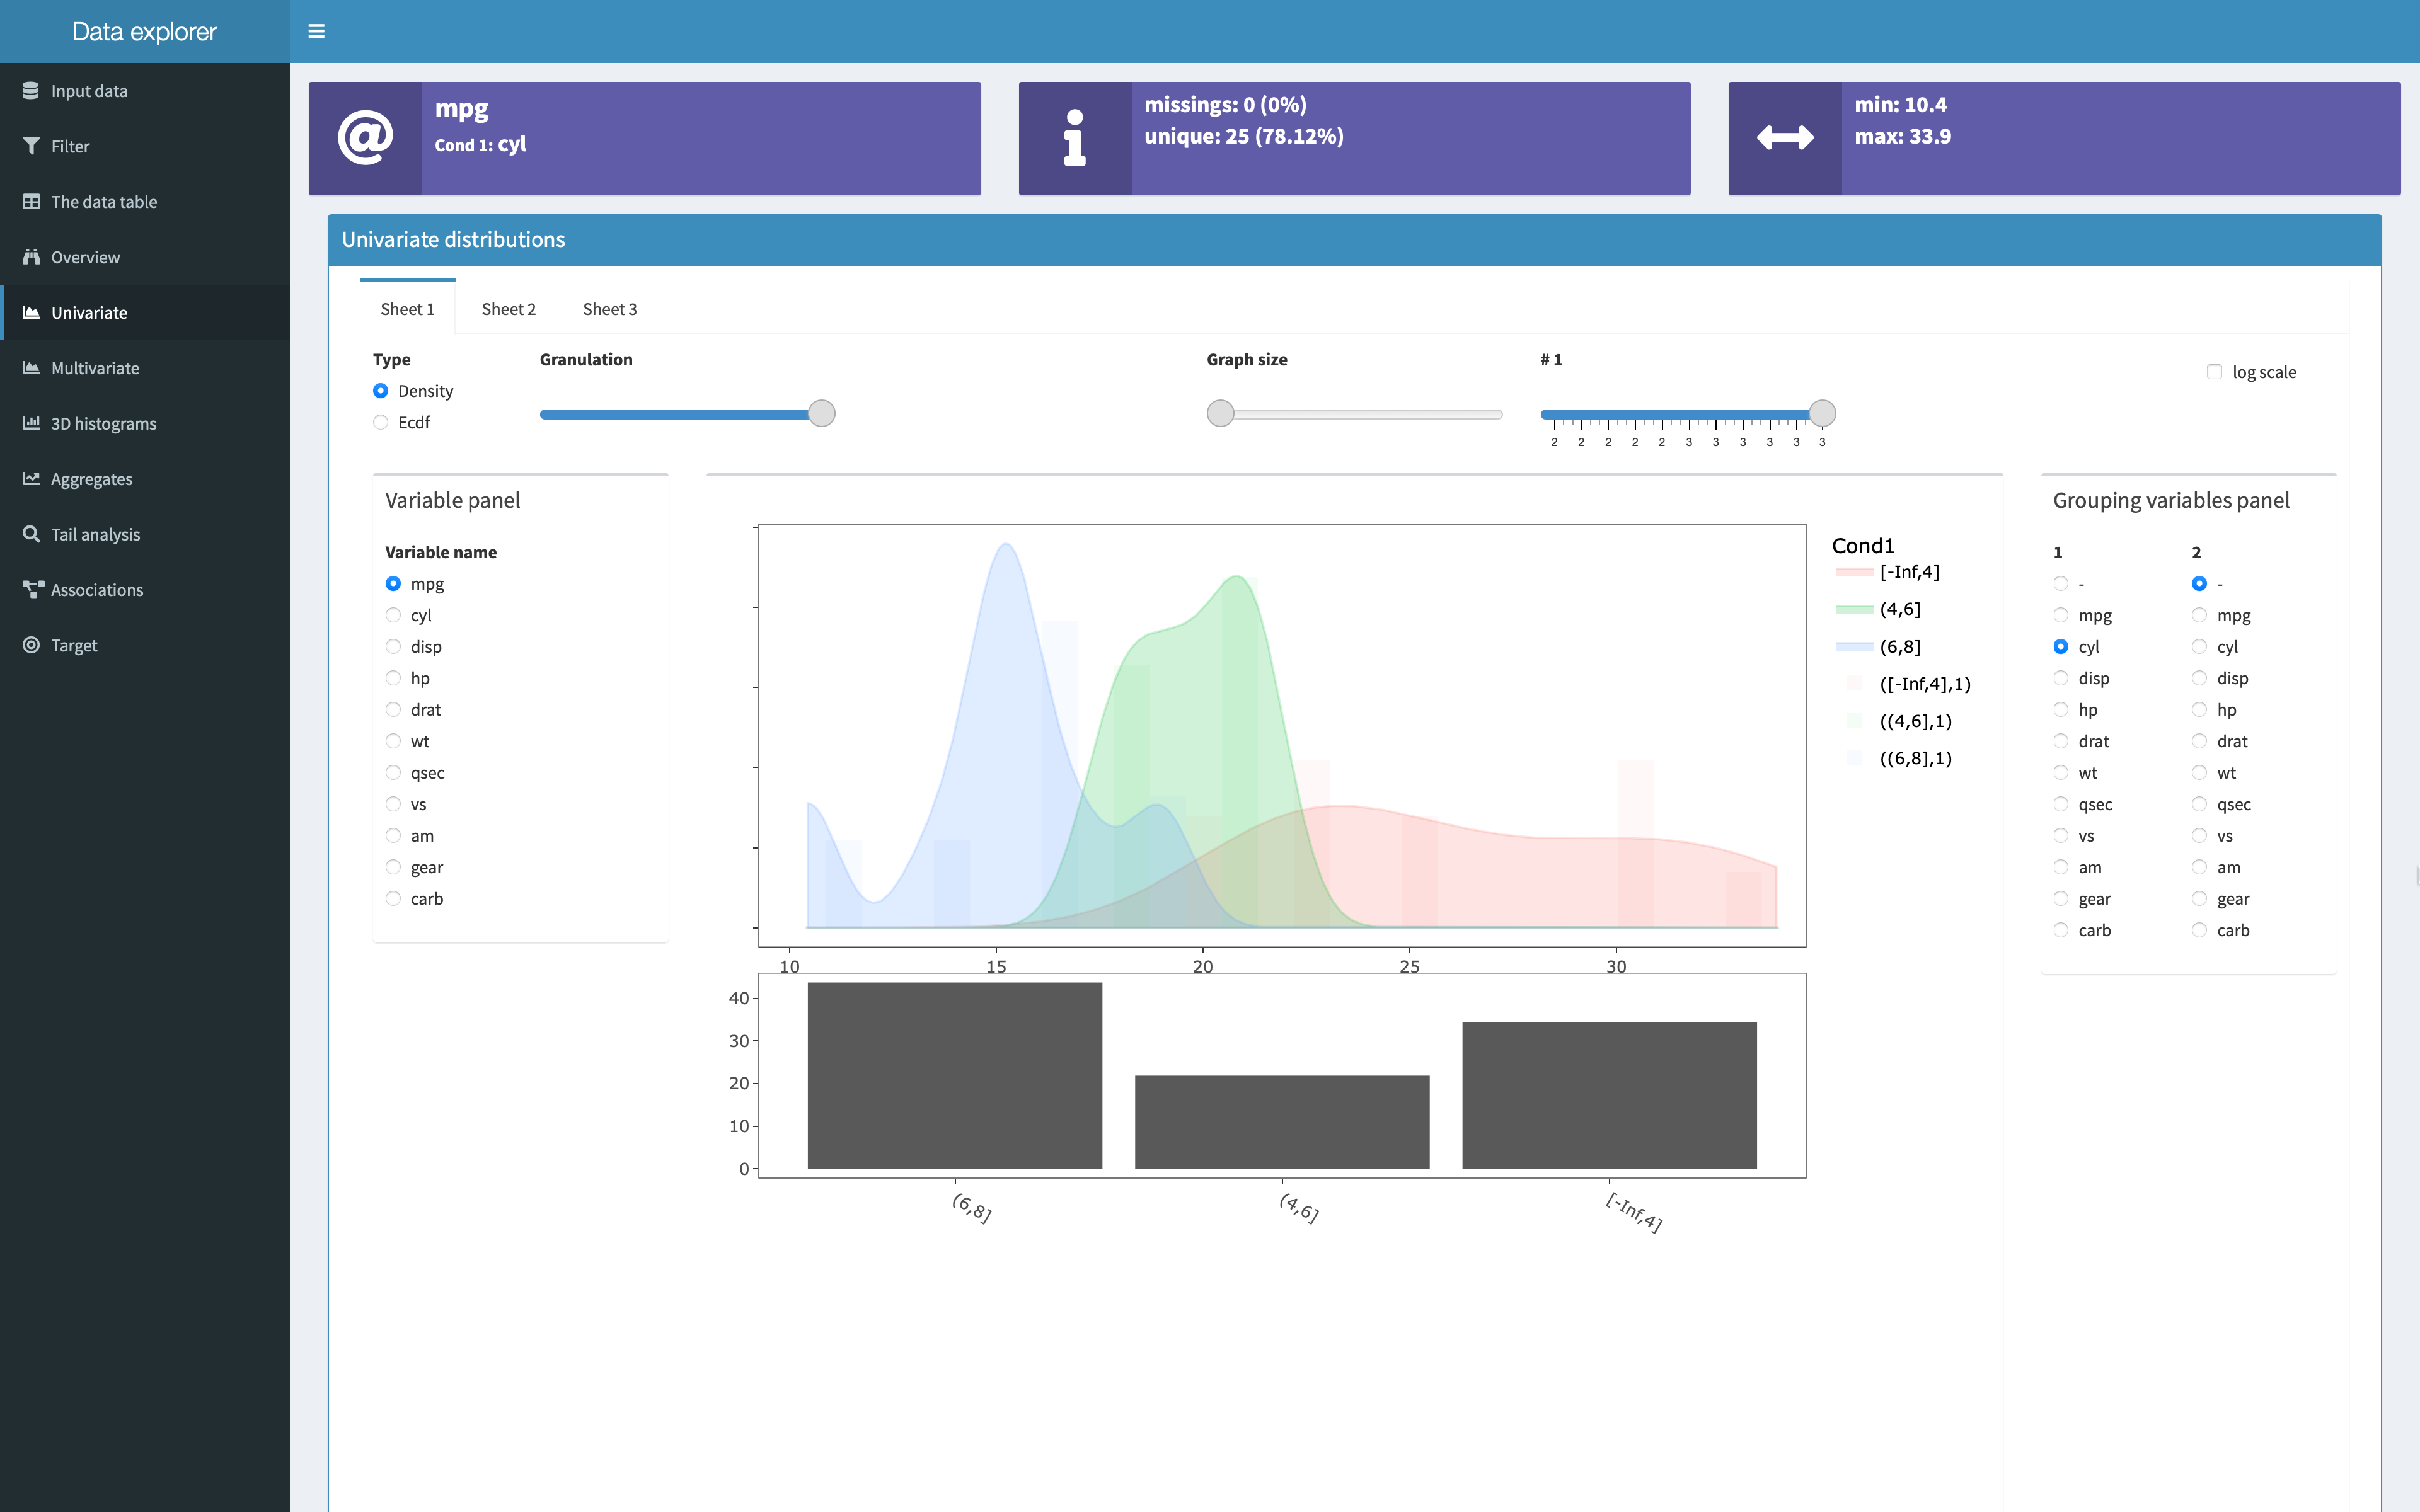
 Density of miles per galon for each number of cylinders.
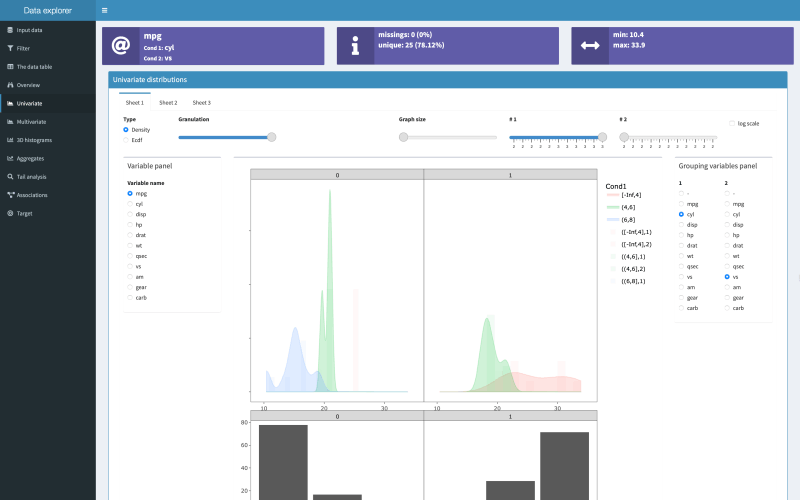 Density of miles per galon for each number of cylinders for two types of engines (1: straigth, 0: v-shaped)
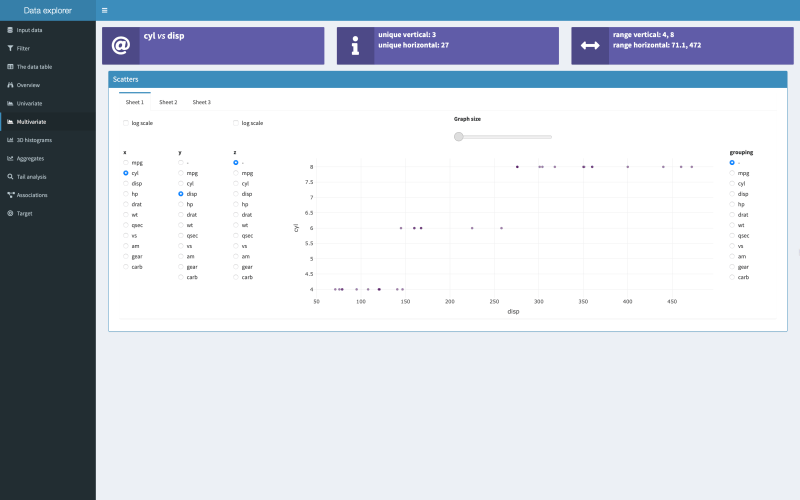 Scatter plot of number of cylinders and displacement.
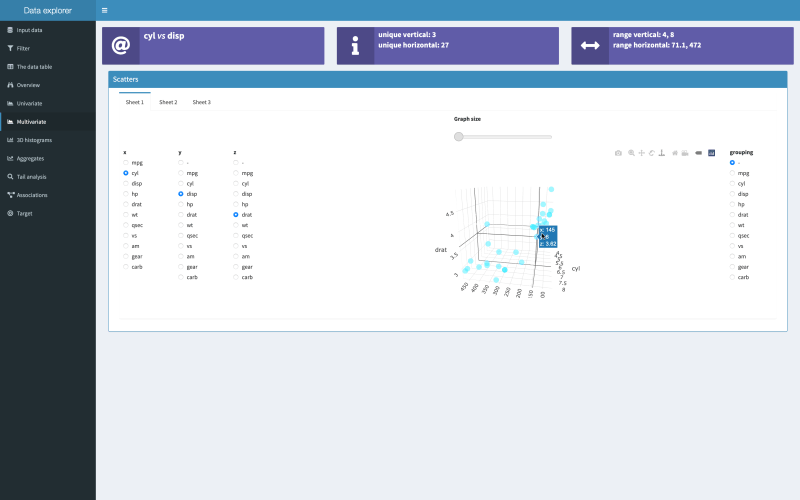 3D scatter plot of number of cylinders, displacement, and rear axle ratio.
 3D histogram of miles per galon and displacement.
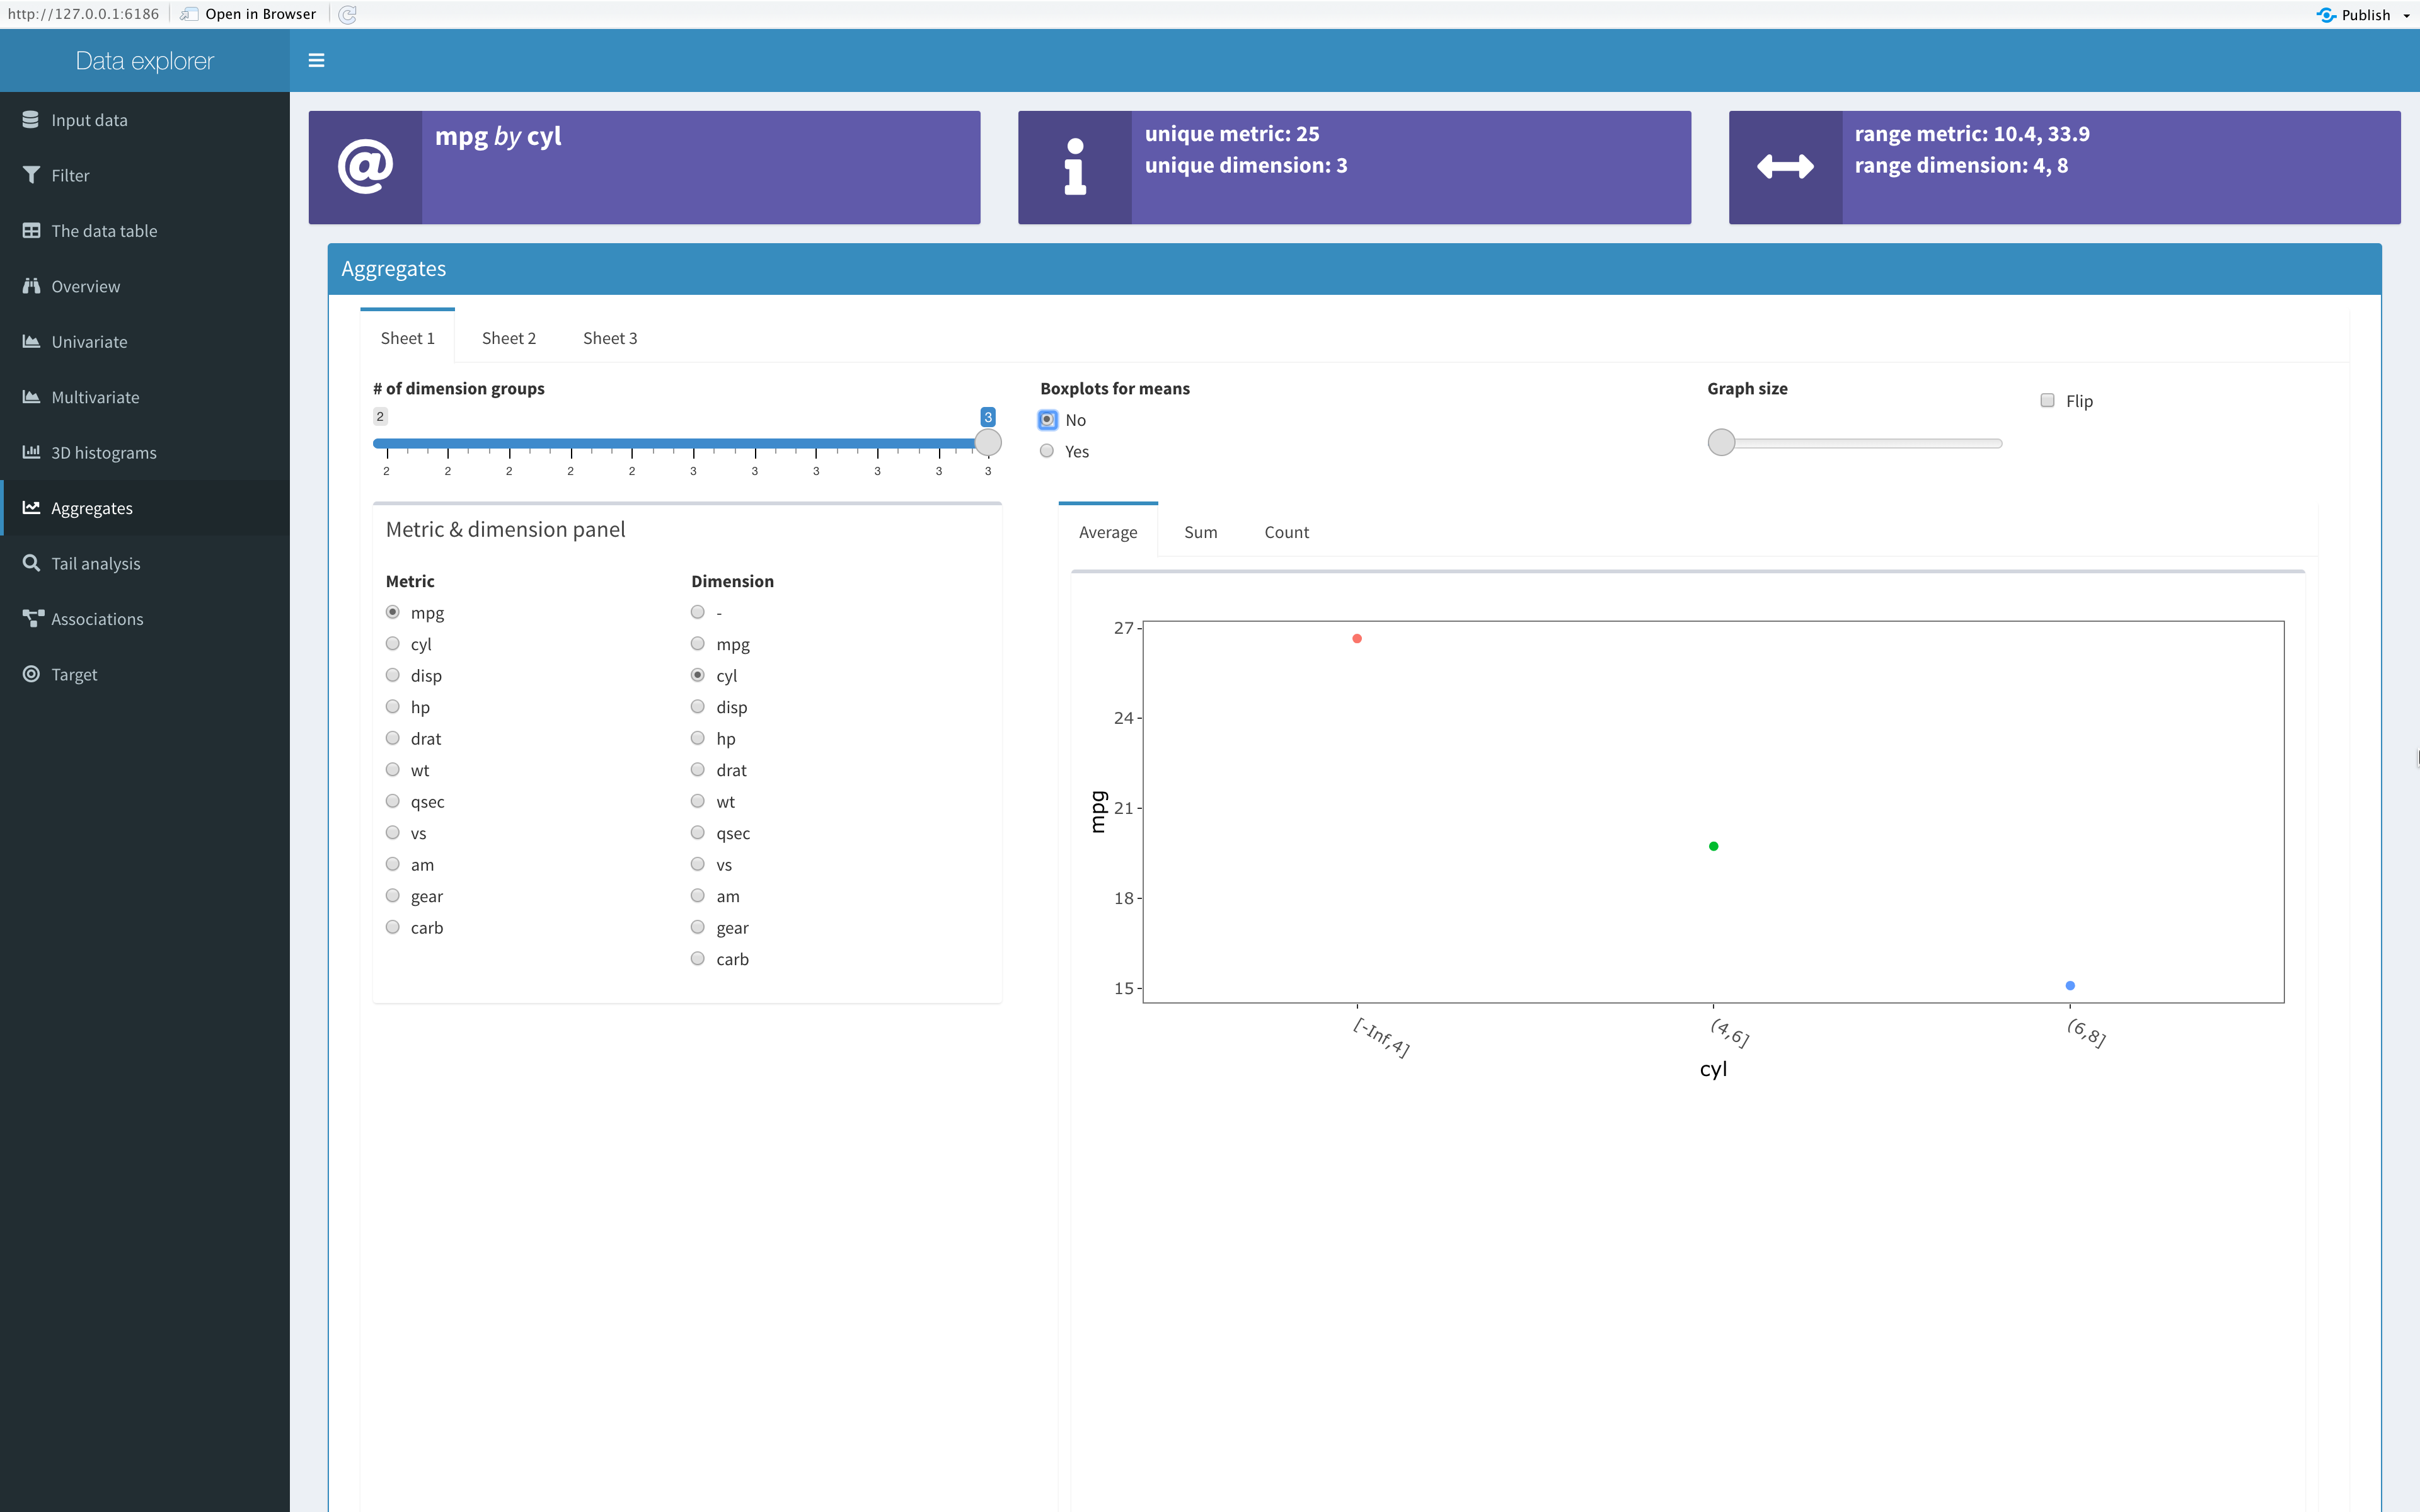
 Average miles per galon for different number of cylinders.
 Average miles per galon for different number of cylinders with boxplots representing distribution of mean estimator.